
Bell Investment Advisors: June 2023 Webinar
Charting the Path Ahead: Mid-Year Market Recap and Inflation Outlook
Speakers: Laurent Harrison, CFP®: Senior Investment Advisor, Financial Planner
Ryan Kelley, CFA®: Portfolio Manager
This transcript has been edited for clarity.
Slide 1: Charting the Path Ahead: Mid-Year Market Recap and Inflation Outlook
0:00 Laurent Harrison: Welcome to today’s webinar, Charting the Path Ahead: Mid-Year Market Recap and Inflation Outlook. My name is Laurent Harrison, Senior Investment Advisor and Financial Planner. I’m joined here today by Ryan Kelley, Lead Portfolio Manager and Research Analyst for Bell.
0:17 Ryan Kelley: Thanks. Happy to be here.
0:20 Laurent Harrison: Great. So today we’re going to be having a Q&A format on several key topics. I’ll get to that in just a second. But if you do have a question, please submit those via your questions bar and we will follow up individually with you after the presentation. We are not actually able to take questions live today. Also, a recording of today’s webinar, along with a transcript, will be posted to our website within 48 to 72 hours. But the slides are also available upon request after the webinar is over.
Slide 2: Webinar Overview
00:56 Laurent Harrison: So what are we going to be covering today? One of the key topics is going to be where we are mid-year at the moment, with a couple of slides on what’s going on with the U.S. economy. We’ll certainly touch upon interest rates and Fed policies since that’s been a popular topic over the last 18 months.
01:14 We’ll then move into what’s going on with U.S. inflation and the direction there. Ryan would like to really get into the type of U.S. market rally we’re having. He defines it as “narrow”, and he’ll get more into that. And then we’ll have one slide on debt ceiling resolution because that was a hot topic prior to June 1 this year. And then what about real estate, both commercial and residential?
Slide 3: Terms Used in Today’s Webinar
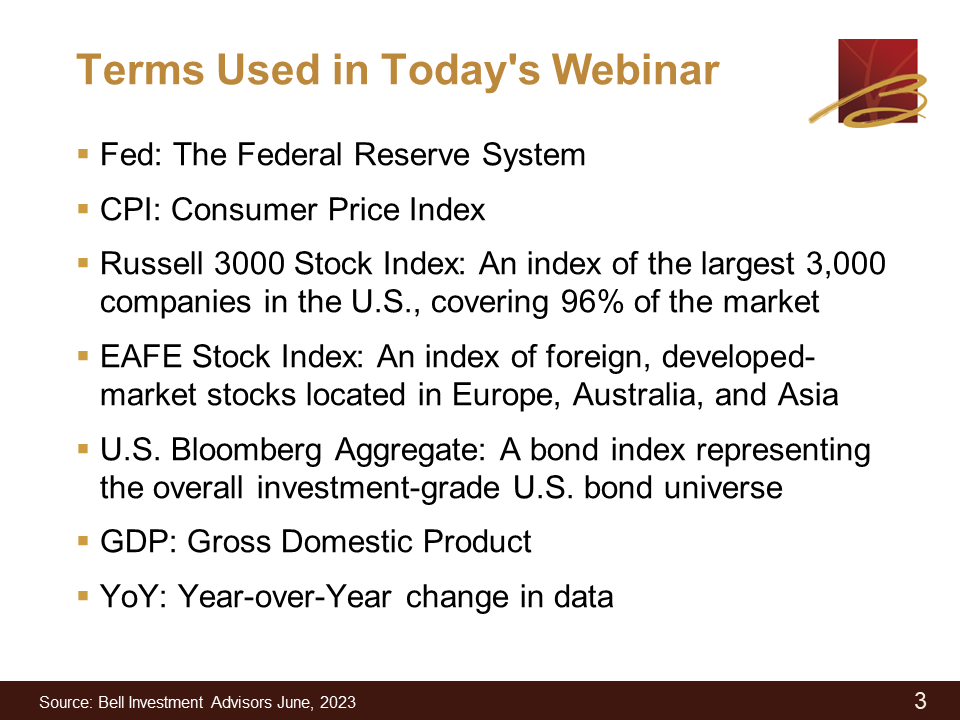
01:40 But before I let Ryan jump into the mid-year market recap, I did want to cover the following slide, which is several terms that will be used in today’s webinar. So, whenever Ryan or I talk about the Fed, we’re really talking about our Federal Reserve System, which is responsible for setting monetary policy. The term CPI refers to a consumer price index, which is really a measure of inflation.
02:08 Several indices to stocks. One is the Russell 3000, which is an index of the largest 3,000 companies in the U.S. The EAFE Stock is an index of foreign, developed-market stocks located in Europe, Australia, and Asia. And then the third index we may refer to is actually a bond index called the U.S. Bloomberg Aggregate, which is a bond index representing the overall investment-grade U.S. bond universe.
02:37 Then a couple like GDP, which is Gross Domestic Product and then YoY or year-over-year. My first question to Ryan in this format is going to be as follows. Let’s start by hearing from you about both the stock and bond market this year. And then we’ll go into more detail on other topics. Ryan?
Slide 4: Mid-Year Market Recap
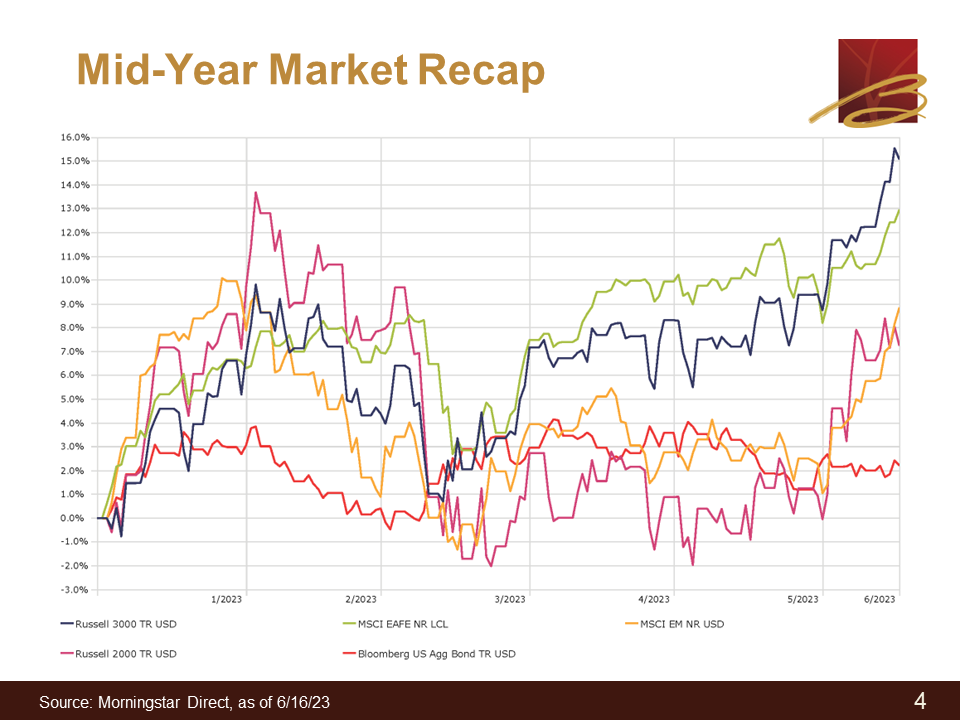
03:00 Ryan Kelley: Right. Thanks. This is year-to-date. All these numbers are as of June 16. The overall U.S. stock market as represented by the Russell 3000 had a total return of about 15%. So obviously, quite a strong return with not even half the year completed. Foreign stocks have also done pretty well. They are lagging a bit, over 13% year to date, again as of June 16.
03:25 What’s interesting is when we look at other types of stocks or categories of stocks. So U.S. value style stocks, U.S. small caps, foreign small caps, or emerging markets, all of those stocks have lagged quite a bit. And I’ll talk about later on in the webinar, why that’s the case. And it’s really just due to what I’m dubbing as a “narrow stock market rally.”
03:51 But on the fixed income side, we’ve also had a reasonable gain of a little over 2% year to date. Now interest rates, at least over the long-term part of the yield curve, they really haven’t budged much, whether we’re comparing where rates were now versus the start of the year. It was almost the same number when I checked this on the 16th. The short end of the curve has come up a little bit and that’s in response to the Federal Reserve rate hikes as well as expectations for additional rate hikes.
04:24 What was happening previously, there was this expectation that’s been in place for quite a while, that the Fed was going to cut just a few months out and those expectations kept getting extended a few months out, then a few months out, then a few months out. So at one point markets were expecting the short-term Fed Funds policy rate to top out at 4.5%. Well now we’re above 5% and it still looks like there are going to be more hikes on the horizon. Market expectations have been persistently underrating what the Fed was going to do and, since they’ve continuously had to readjust those expectations, there’s been a rise in short-term rates.
05:04 Laurent Harrison: Great. Thank you for that quick market recap. Next, I think our listeners would probably like to hear your perspectives or your insights about the current economy in the U.S. But before we go there, maybe a couple of comments about the banking crisis that occurred earlier this year in March.
Slide 5: U.S. Banking Crisis – Key Points
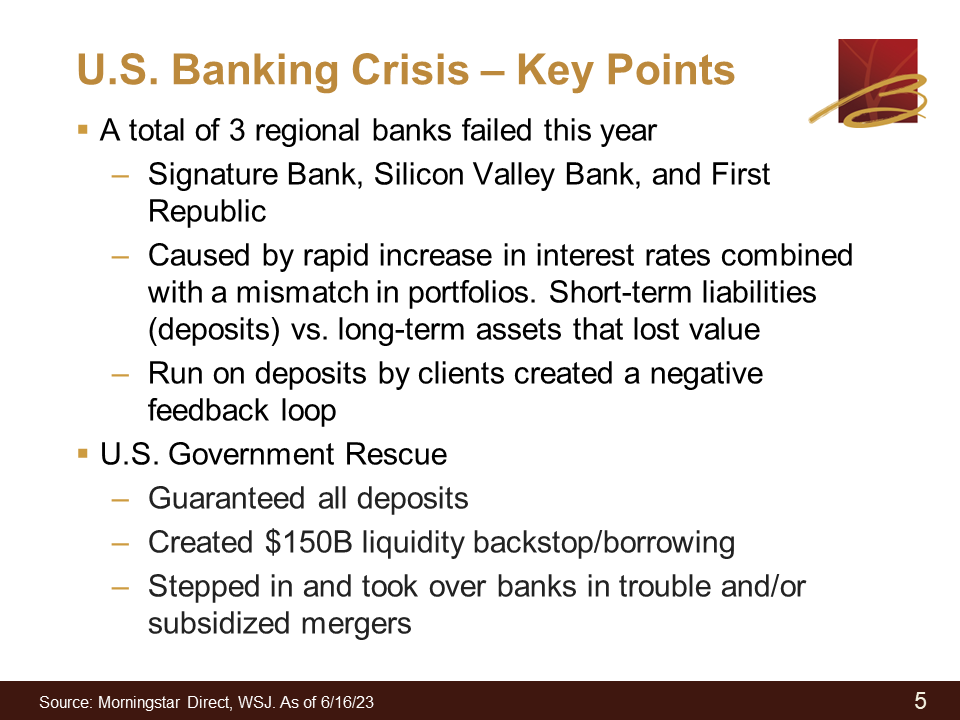
05:25 Ryan Kelley: Sure. I’m sure that clients are well aware, since this was in the news pretty heavily, that there was a collapse of a few medium-sized banks in the United States, as well as one not listed here, which was UBS out of Switzerland. They all had slightly different reasons for that. But what really initially sparked this was that Silicon Valley Bank essentially had a large number of deposits that were uninsured. They were deposited by businesses. And since they were uninsured, they were a little bit at-risk of being pulled out if there was a sign of potential losses.
06:07 Meanwhile, they made some mistakes in their portfolio where they had a mismatch. And this was actually true of a number of banks. They had a mismatch between their liabilities, which are their deposits, and portfolio of investments. So, they were investing long-term, and their liabilities were short-term [in] nature. What happened was, when interest rates rose, the value of their portfolio of long-term assets declined. And then Silicon Valley Bank actually had to put out an announcement that they had to issue new stock to replenish their depleted capital from losses on their portfolio. That just sparked an immediate run on their bank.
06:52 All these startups pulled money out because they were uninsured, for the most part. It just became a self-fulfilling prophecy and the bank collapsed. Then once that bank collapsed, the panic started spreading to other banks, like Signature Bank, First Republic Bank, which suffered from a similar issue of mismatched liabilities and assets and unrecognized losses from these assets on their balance sheet that had to be recognized once deposits start getting pulled.
07:22 So this negative feedback loop was created, and we saw bank after bank falling. The U.S. government stepped in, and they wanted to avert a panic. They basically said officially or unofficially in certain cases, we’re going to guarantee all deposits and the strong implication was that would be true across other banks if they were to happen to fail. This immediately calmed the market. So, there was less risk of a run because of the Federal government saying, “Hey, don’t worry about this. If the bank fails, we’ll make you whole on your deposits.” Suddenly, you don’t have an impetus to yank your money out if you’re concerned about your bank. They also did some liquidity programs as well.
08:04 And then as well, when some of the banks did fail, they stepped in to provide subsidies and facilitate mergers with other healthier banks to prop things up. They managed to put out the fire. I’m not the one who ever will say that the fires have been put out and the problem is definitely behind us. But at least in the short term, that appears to be the case.
08:28 Laurent Harrison: Great. So, what about the U.S. economy today? How’s it looking?
Slide 6: U.S. Economy Today
08:31 Ryan Kelley: Actually, it looks pretty strong. There has been this persistent idea, I’d say over the last year, that there was a recession on the horizon, always about six months out. And six months would come and well, now it’s still six months out. Just like this idea of the Fed was going to cut rates, this idea of a recession beyond the horizon kept getting extended out as well. So, if I look at the U.S. economy, the first quarter of this year was positive with positive economic growth. If I look at estimates of the second quarter, which we haven’t quite finished yet, both forecast or there’s also a widely watched Fed model, which uses different data series and tries to apply some statistical techniques to forecast it. They’re both predicting positive GDP in the second quarter of about 1.5% to 2%, roughly.
09:23 It looks like we’ll get a second quarter this year of positive GDP growth. Part of what’s behind that is a persistently strong labor market, despite all these Federal Reserve rate hikes that have happened. The labor market is still extremely tight and may actually be accelerating as far as tightening even further. On the negative side, there have been some negative economic indicators (in this case) for a few months now. Manufacturing sectors and contraction services is slightly above water but roughly flat.
10:05 So, there’s a number of these indicators that are negative, but that’s also been the case for quite some time, as has a strong labor market so that divergence hasn’t really been resolved at this point. A few other negative factors I’d point out are more globally, looking outside the United States. The European Union is already in a recession. They had a negative (as a whole) result. The final quarter of last year was negative. And the first quarter of this year was slightly negative. It’s barely below zero, but since it was a contraction, it counts as a recession.
10:40 A lot of that weakness is actually coming from Germany, and some of the other large economies such as France are still expanding. It’s not a severe recession. So far, it’s pretty minor, but it certainly is not helping things. The other thing that’s not helping things is the Chinese economy. I want to be clear, it’s still growing, at about 5%. But there was expectations for a much larger rebound post-COVID restrictions, and that seems to have fizzled out and expectations are being lowered. So at the margin, it’s negative even if their economy is still growing.
11:17 Laurent Harrison: Super. Just to summarize, things are going a little bit better. It sounds like in the U.S. economy, even though we have a tight labor market, etc, but there’s maybe a few cracks showing on the global economy. But obviously, it’s still not reflected in the stock market since we’ve had a pretty good return there. I will point out that emerging markets have been struggling a bit this year. My guess is maybe the Chinese economy, and the fact that it’s slowing down (it’s had some real estate issues) that could be having an impact I’m guessing on emerging markets. Is that fair to say?
11:56 Ryan Kelley: Yes. They’ve had real estate issues that came about earlier with Evergrande (that property developer that was close to default) as well as they also have a problem with high youth unemployment, despite the fact that their economy is growing about 5% still. And remember, with a lot of financial markets, it’s not what the result is but it’s more the change in expectation. So, if people were expecting, say an 8% growth and it’s suddenly 5%, well that’s still positive. That’s not going to be good for the stock market price movement.
12:31 Laurent Harrison: Got it. We still have clients invested in emerging markets and we’re not necessarily exiting that. So, it sounds like we’ll stay with that. Okay, great. Well, maybe you can talk a little bit about where the U.S. is then, in terms of interest rates and Fed policy, since that was what precipitated I believe, the 2022 downturn – and maybe you can talk about where we are today with those.
Slide 7: Interest Rates & Fed Policy
13:00 Ryan Kelley: So the Fed is still worried about inflation. We’ll see in the next chart that inflation has moderated quite a bit. It’s still about double where the Fed’s targets, so it’s still at an elevated level. And this is despite a historically rapid pace of interest rate hikes going from 0% to over 5% in fairly short order. They just concluded a meeting this month, where they actually did not hike rates. That’s been the first meeting in quite some time, since they started this whole hiking cycle, where there hasn’t been an interest rate increase.
13:42 What they did signal is that there still will likely be further hikes this year (data dependent) but we may get one or two hikes throughout the year. I also mentioned how there’s been this expectation of cuts and that hasn’t come yet. And so it looks like interest rates, at least in the short term, are still going to go higher. A lot of that is because with inflation still elevated the job market still very tight. Consumer demand is still very strong. It looks like the Fed will look at that and say, “Well, we’ve hiked rates so far, but it doesn’t look like there’s a whole lot of pressure curtailing demand at this point.” And so it looks like they want to go further.
14:25 As far as when rates might start to decrease, at a really high level, rates are likely to follow inflation. So, as long as inflation stays high, rates will stay high. If inflation falls, rates should fall. The one exception to that would be if inflation stayed a little high, but there was some type of severe financial or economic stress, you could see the Fed have their hand forced and cut rates to some extent, depending on exactly what the event was that was doing that. They don’t want to cut, but there’s certain stressors that could occur that would force their hand to cut even if they’d rather not. And again, the markets have been persistently predicting the Fed will be cutting. It’s always just around the corner a few months out, that they’re going to cut. And that’s just been wrong, wrong, wrong, over and over again.
15:20 Laurent Harrison: That’s great to understand that a little bit better. I know that part of the reason for the bounce back in markets starting in October of last year was due to that anticipation that the Fed would start cutting rates and obviously bring interest rates down. And I believe that also higher interest rates and Fed policies are what caused the downturn last year. But I know that all of that was really focused on keeping inflation in check, so to speak. So maybe you could share with the audience the direction of inflation in the U.S. and why that’s important.
Slide 8: U.S. Inflation Update: CPI Index
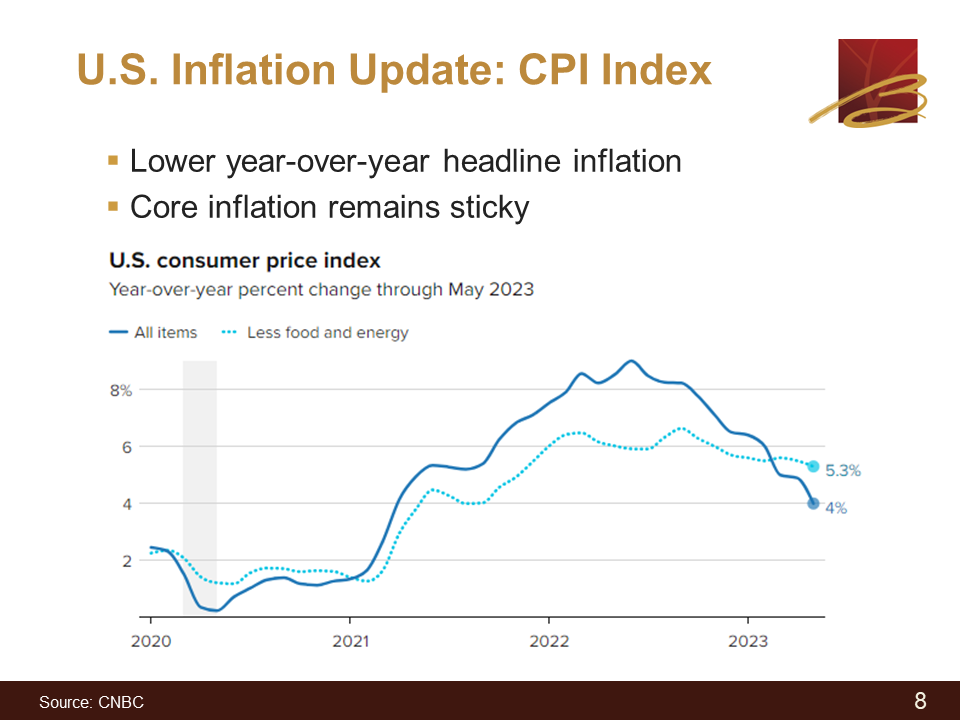
15:59 Ryan Kelley: Looking at this chart, the solid darker blue line is year over year. The current prices looking back twelve months and seeing what the growth rate is in the consumer price index or CPI. You can see the label, that the latest read is we have a 4% year-over-year inflation number. That’s obviously come quite a bit lower than where it peaked last summer, which was above 9% on the same year-over-year basis. But if you look at the dashed lighter blue line, you can see it’s showing core inflation. This is the consumer price index, but stripping out food and energy which are more volatile. This is used a lot of times to see the underlying trend of inflation. And you can see that, yes, inflation on the core basis has moderated somewhat, but not nearly as much as the overall headline inflation has, and it’s still at quite an elevated level of 5.3%. Even the 4% number, as I mentioned, is double the Fed’s 2% target. So there’s been a lot of improvement, but not enough to cause the Fed to change course at this point.
17:12 Laurent Harrison: Got it. So inflation is still a bit of a concern, at least from the Fed’s perspective.
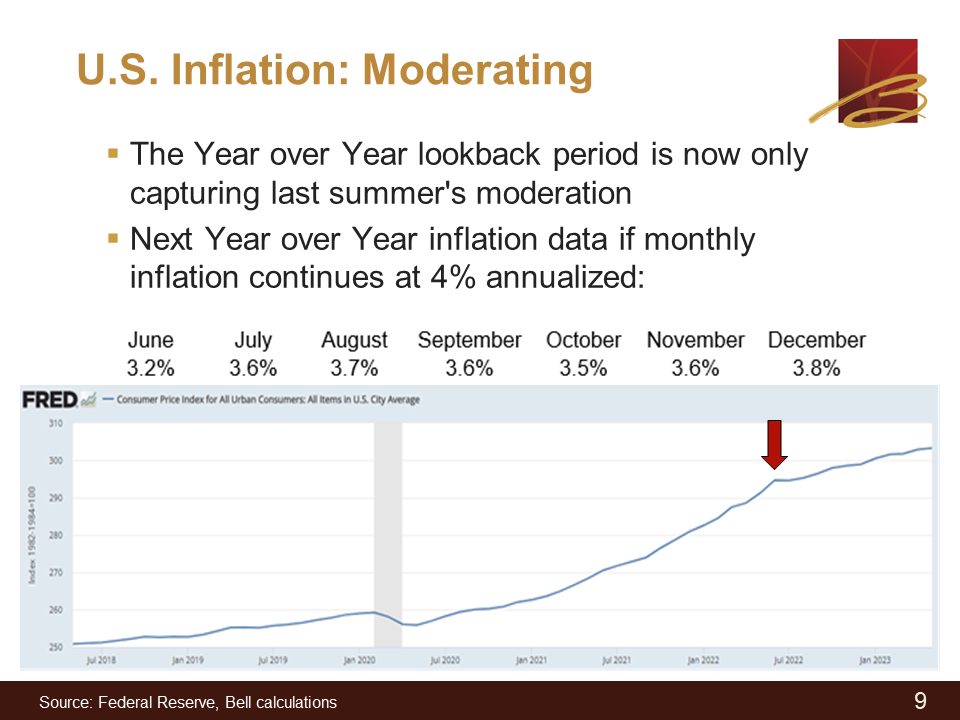
Slide 9: U.S. Inflation: Moderating
17:18 Ryan Kelley: Correct. Here’s another way to show inflation. This is just the raw index of the CPI. I added a red arrow. Again, this is looking back at last summer, you can clearly see where the slope of this line flattened out, which is when inflation started to moderate. The other thing I did is, I just said, “Look – if the last number we had was 4%, what if prices just continued at an annualized rate of 4% over the following months, what would the year-over-year number look like?” And that’s what the table you can see listed is. Since the lookback period of next month, CPI is at a lower number and a more moderate number in June. You’ll see this year-over-year number probably decline quite a bit, but then may rebound and stay a little elevated. So just don’t get your hopes up if you see a pretty benign CPI number (the next data point when it comes out) because it may still rebound as things progress through the months of the year.
18:19 Laurent Harrison: Got it. So inflation is moderating, which I’m assuming is a good sign, but what about shelter, rent, things like that?
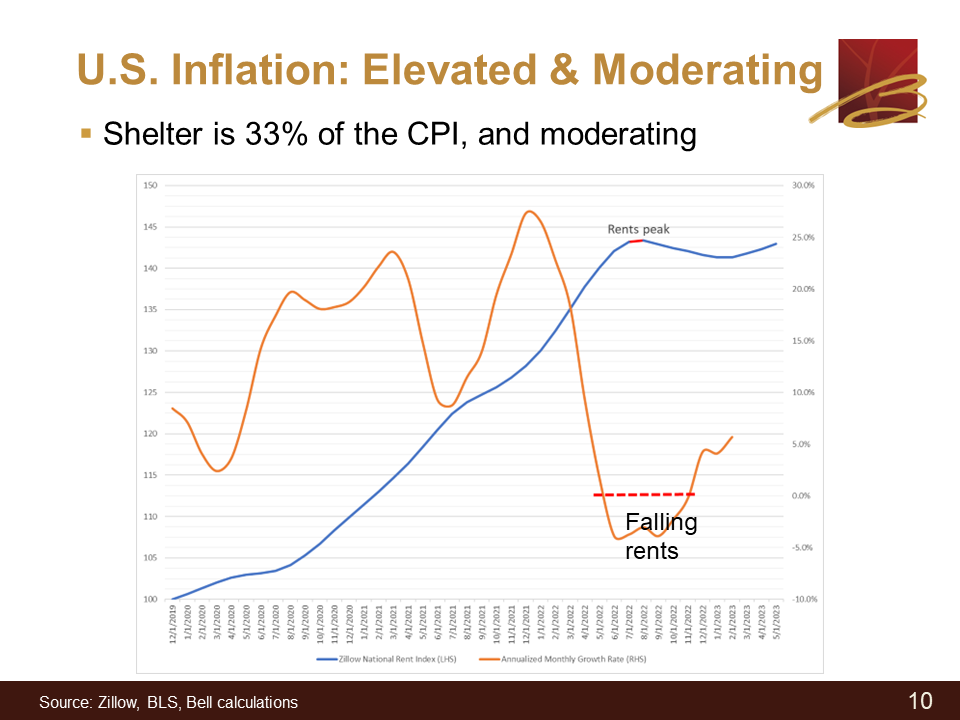
Slide 10: U.S. Inflation: Elevated & Moderating
18:30 Ryan Kelley: Without getting some of the technical details, shelter is about one-third of the CPI. And you can see it’s moderating. Now I’m showing here just rents, which are only a portion of how shelter is measured, but if we use that as a proxy for overall shelter, you can see that not only has it moderated already, but actually it was declining in recent times as well and still remains below where it peaked last summer. So, when you have a third of the index basically going sideways, that’s certainly going to help moderate the overall inflation number. This may be another good sign when shelter has essentially stopped having any inflation whatsoever. In fact, in recent times, it had deflation. And that’s a third of the benchmark. That’s one optimistic sign for inflation cooling off.
19:27 Laurent Harrison: Okay, well that’s super helpful to hear that inflation looks like it’s moderating, which seems like that’d be a positive sign for both the U.S. economy and U.S. stock and bond markets. Would you agree with that statement?
19:42 Ryan Kelley: I would agree. So, high interest rates suppress asset prices. If you see rates go down, all else equal, that should boost your stock portfolio as well as your bond portfolio in the short term. The only caveat to that is, why did rates go down? If rates went down because there was some economic turmoil, that might off-set the reduced rates in your stock portfolio, but it would certainly help at least in a risk-free bond portfolio.
20:17 Laurent Harrison: Got it. All right. Well, that’s helpful to understand a little bit more about inflation and the fact that it is moderating. Let’s kind of go in a different direction now. It has to do with the debt ceiling issues we had earlier this year. So, why was that such a hot topic for just about everyone?
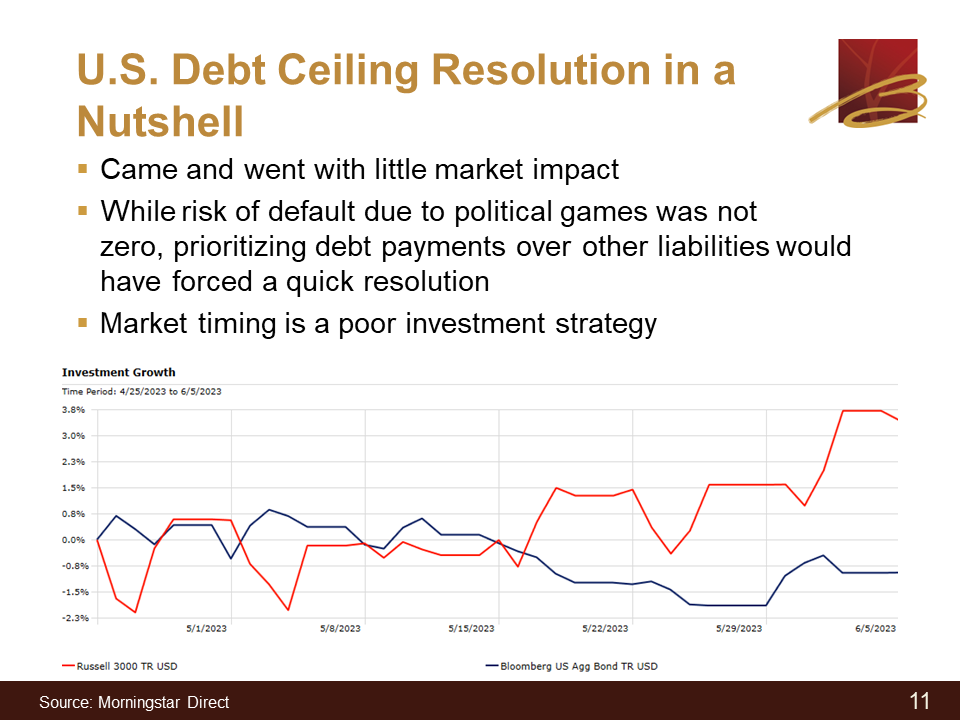
Slide 11: U.S. Debt Ceiling Resolution in a Nutshell
20:36 Ryan Kelley:It was such a hot topic because if there was a default, where the U.S. government stopped paying interest and principal back to its lenders, that would almost certainly cause a pretty serious financial crisis. So much of the financial system is based around what we call the risk-free rate, which is measured by the debt interest rate on U.S. government securities. So, if you have this entire financial system structured around that, and suddenly the base market stops functioning, that can cause a pretty widespread panic. What’s interesting though, is it did come and go with little market impact. You can see from the chart, the red line being the U.S. stock market and the blue line being the U.S. bond market, stocks went up and bonds declined slightly over this whole episode. What I would add though, is having watched this episode and previous episodes where there was a battle over the debt ceiling. I’m starting to come to the belief more and more that it’s actually a pretty big distraction without a lot of substance.
21:46 The reason being is if there was a failure to increase the debt limit, I think the likely course would be the Treasury would still pay interest and principal back to the lenders to the U.S. government, and they would then stop paying other bills (to contractors, to people who are owed Social Security checks, etc.), which would protect the financial system and also place enormous pressure on the politicians to resolve the problem quickly. So, I think that amount of pressure may actually serve as a pretty big deterrent to ever really having this type of event occur, as if the financial crisis wasn’t bad enough.
22:34 The final thing I’d mention is that this is one more example that shows that market timing is really not a good strategy. If you were worried about the debt ceiling issues and you said, “I’m going to sell my stocks.” You can see in this chart that that wouldn’t have been a good strategy. Maybe for bonds that would have somewhat worked out, but remember, it’s hard to attribute interest rate increases to specific events. So was that really caused by the debt ceiling fears or not? And still, interest rates never went above where they peaked earlier, either. It’s hard to say that was really the cause of moderately higher rates over this time period.
23:15 Laurent Harrison: Got it. And we presented the messaging to a number of our clients that there wasn’t a point in changing their investment portfolio or selling out early or anything like that, even though it was in a lot of headlines and there was a lot of concern over it. It sounds like that messaging was the right messaging, and of course we have the same messaging in our monthly newsletter as well. So overall, Bell’s position that [if you wanted to take action] maybe adding a little extra cash to your savings accounts could be a helpful action to take. But overall, what we’re seeing here proved that trying to make a big decision based on market headlines is generally the wrong one. So that’s super helpful.
24:06 Well, let’s move in a different direction now. Let’s talk about the current stock rally. My understanding is that the current rally is being pushed upwards or being pushed positive by just a few stocks here in the United States. And to put it bluntly, I think you and I have talked about it, you have some concerns about this type of market rally. Why don’t you explain to our audience why?
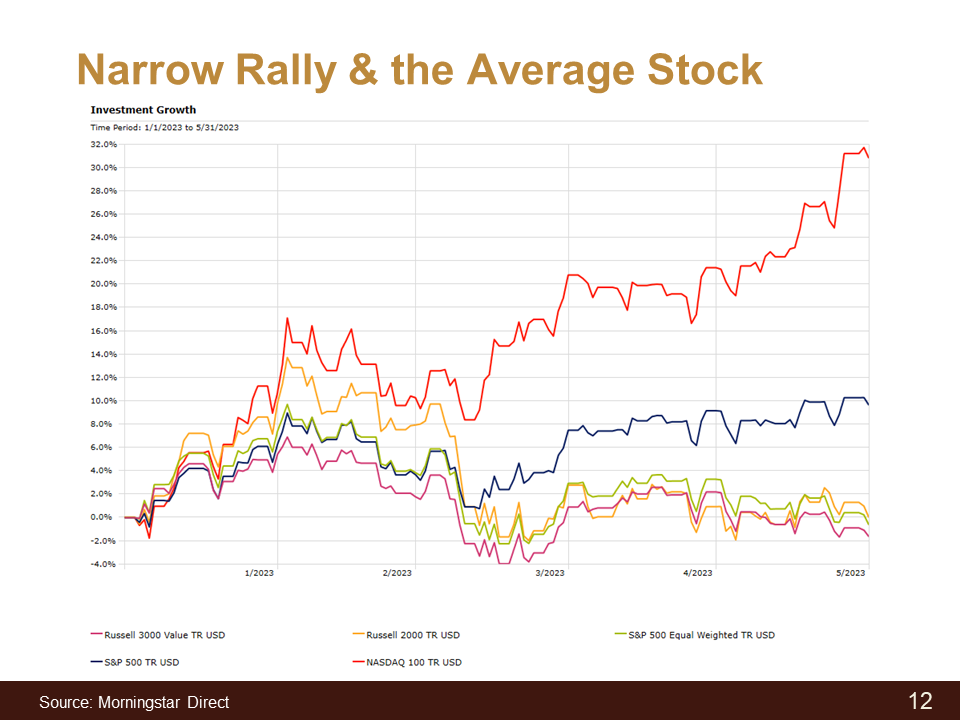
Slide 12: Narrow Rally & the Average Stock
24:33 Ryan Kelley: On this chart, there’s a few more benchmarks, but you’ll notice that you’ll see a red line that’s done really well. A blue line has done pretty good. And then everything else kind of clustered together at the bottom, which hasn’t really gone anywhere. The red line is the NASDAQ 100, which is a measure of mostly technology stocks. The blue line is the S&P, which includes a lot of those technology stocks. Then all the stuff at the bottom: you have small-cap stocks, you have U.S. value stocks, all cap large and small. And then most interesting, the green line, which is the S&P 500 but equal-weighted.
25:10 So if you compare the blue line, which is the regular S&P 500 versus the green line, there’s obviously a pretty big divergence in that and that’s just a measure of showing that the rally we’ve had is such a narrow rally. It’s been a handful of stocks, technology stocks primarily, that have driven it higher. Meanwhile, if you just look at what the experience is for the average stock in the benchmark, it actually hasn’t really gone anywhere. So it’s just one way to show how narrow things have been and just a few stocks really driving all the gains and everything else not really doing anything.
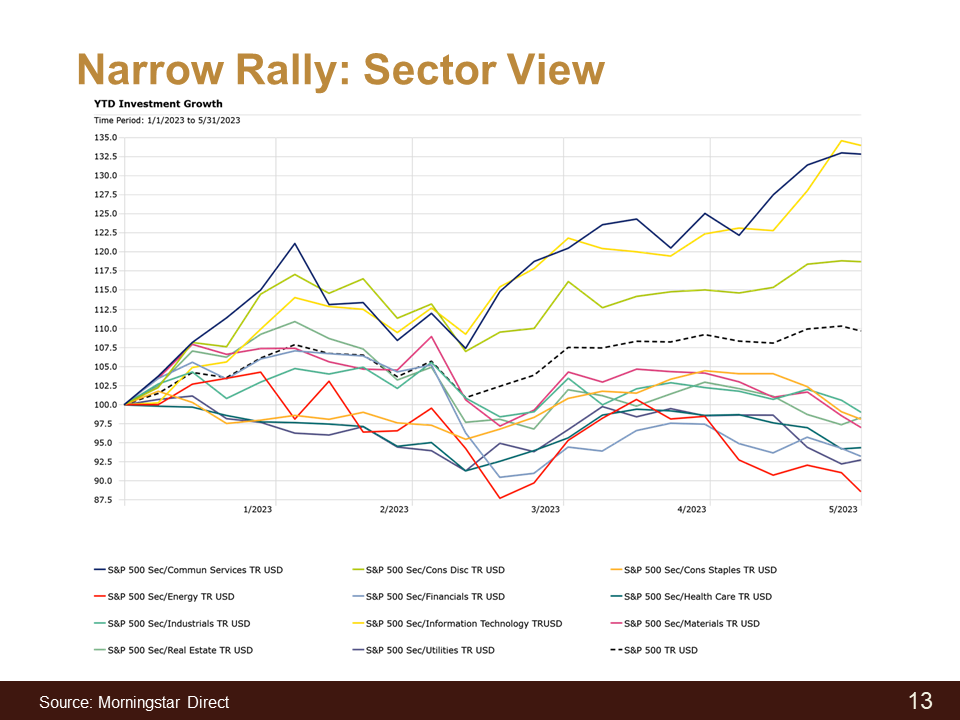
Slide 13: Narrow Rally: Sector View
25:48 Ryan Kelley: This is just another way to analyze the same issue. We’re looking now at a sector view. The black dashed line is the S&P 500 again, and then all the sectors that compose that same benchmark. And you’ll notice there’s three lines above and then everything else clustered at the bottom, which has mostly declined this year. We have consumer discretionary, communications and information technology doing really well, and then everything else (utilities, material, health care, energy, etc.) doing poorly and in fact, in most cases actually losing money. So it’s just another way to see the divergence, whether it’s at the sector level or style level, etc. just how few stocks have done well this year.
26:36 Laurent Harrison: Got it. So I guess the next question would come about with growth doing so well. Maybe we should pile all into these few names. I think it’s seven or eight or nine different names and we can take a look at these areas both year-to-date, as well as a little bit longer term. I’m pretty sure you’ve said you need to take a look at the performance over a longer timeframe rather than just a very short timeframe. But let’s look at the data year-to-date to start with.
Slide 14: Narrow Rally: Styles & Size (YTD)
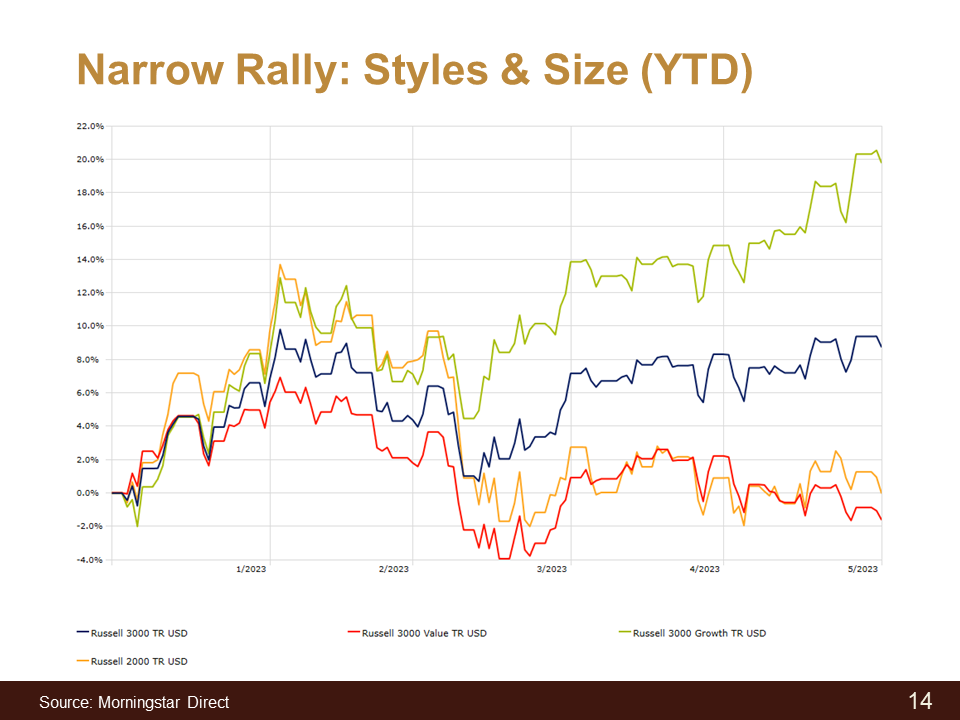
27:08 Ryan Kelley: Sure. Some of these same benchmarks we’ve been looking at, the blue line is the Russell 3000 (proxy for the overall U.S. stock market). The red is [another version of] the Russell 3000, it’s the same benchmark, but divided out just showing value-style stocks. The green showing the same benchmark but divided out showing the growth-style stocks from that benchmark, which is where most of all the technology companies reside. And then the yellow line showing the Russell 2000 which is a small-cap universe, stripping out the thousand largest stocks from the Russell 3000.
27:42 And once again, whether it’s by growth or by sector or by equal-weight versus market-cap-weight, we can see the same divergence which is just different ways of showing the same thing on this narrow stock market rally. The point I want to make though is if we look at this chart, we can see growth has done really well and value has not done very well. And this is looking at year-to-date.
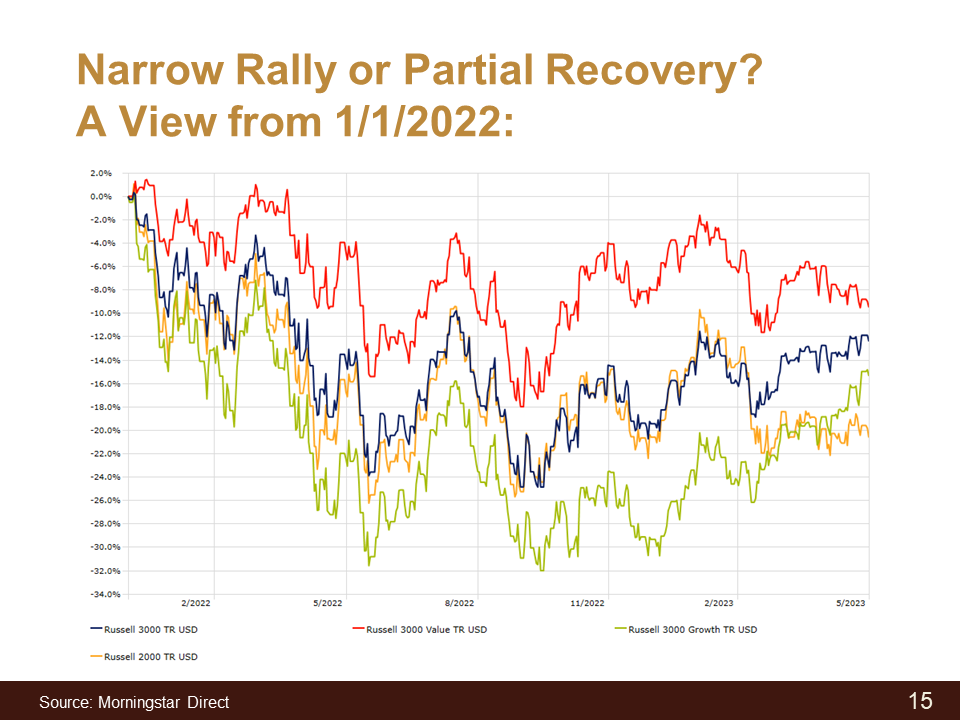
Slide 15: Narrow Rally or Partial Recovery? A View from 1/1/2022
28:07 Ryan Kelley: Once we flip to this slide, same exact benchmarks. All I’ve done is instead of looking at year-to-date, I extended it out where it’s year-to-date plus 2022. And suddenly the script flips. Now we can see that actually the value stocks are still beating growth stocks quite a bit. And it’s really more of a recovery of what did poorly and maybe a weakening or sideways motion of what did well last year. But even combining the two periods, even with this impressive rally that’s occurred this year of I believe it’s 30% for the growth stocks, it still hasn’t even been enough to offset the declines of last year. So you could look at it as a strong rally that’s occurred this year or you can look at it as only a partial recovery of the losses that have occurred last year and there’s somewhat of a rebound but still incomplete.
29:05 Laurent Harrison: Got it. Well, I know a lot of folks are always looking at names like Apple and Microsoft. Thoughts or comments about those two stocks?
Slide 16: Narrow Rally & the Average Stock: Conclusion
29:16 Ryan Kelley: These are two of the stocks that have done really well. A few other ones: Tesla, Nvidia, etc. But specifically with Apple and Microsoft, each one of these on a standalone basis is now valued at a higher rate than the bottom 2,000 stocks of the U.S. market. So again, that Russell 2000 benchmark, either Microsoft or Apple are actually worth more than the entire index combined, which is quite an astounding statistic.
29:47 The other thing I’d point out is that not all, but many of these stocks that have driven most of the gains this year. If you look at the valuation range that they’ve traded at in recent history, most of them are at the upper ranges of that. And if you look at what their actual fundamental profits have done. It’s not necessarily that they’ve been bad, but they haven’t gone up nearly as much as the actual stock prices. So most of these gains are really a reinflating of price-to-earnings ratios rather than some underlying acceleration of their businesses that are justifying these share price gains.
30:27 The other point I’d like to make is that while these large-cap tech companies are becoming more and more expensive, and the overall S&P is as well, if we look at other types, geographies and styles of stocks, we see the exact opposite. U.S. small-cap stocks, foreign small-cap stocks or foreign large-cap stocks, they’re all trading at historical discounts. Meanwhile, the S&P 500 and U.S. growth stocks are trading at an inflated PE versus their own history. So you have another pretty big divergence there going on.
31:06 Laurent Harrison: Got it. So it sounds like U.S. small caps and foreign stocks of all sizes are going to be staying in the Bell portfolios for diversification reasons. But obviously if they haven’t done well, maybe in the recent rally, a lot of times they know there’s a kind of reversion to the mean. You know what hasn’t done well, just like we saw last year, tends to do well in the future. So there’s still hope and expectation that U.S. small caps and foreign stocks should do well longer term. Is that a fair statement?
31:45 Ryan Kelley: Yeah, in some way the rally this year has been the mean reversion versus the declines last year. The relative winners and losers were also a mean reversion. Probably the one exception I’d point out would be U.S. small-cap stocks.
Slide 15: Narrow Rally or Partial Recovery? A View from 1/1/2022
32:00 Ryan Kelley: And actually, if you go back to the previous slide, there was a time they actually suddenly diverged. So looking at the yellow line, that’s small-cap stocks, you can see somewhere around March there’s a sudden drop. They diverge from the blue line, which is the Russell 3000. That was actually the banking crisis. There’s a lot of small-cap banks. And so when the banking crisis hit, that caused a sudden drop in the small-cap index, which otherwise had actually been tracking the overall large-cap benchmark pretty closely.
32:33 Laurent Harrison: Got it. So small caps could have actually been a winner this year if we hadn’t had the regional bank crisis?
32:44 Ryan Kelley: Correct, which also did hit the large-cap value stocks as well, just not as severely. They had done better previously. So over the full time period, they’re holding up better than the small cap index.
32:55 Laurent Harrison: Okay. Well, we’re getting towards the end of our webinar and we don’t want to take too much of our listener’s time. But I know there was one other topic that’s been asked by a number of our clients recently and it has to do with real estate as an investment and the impact of higher interest rates on those real estate projects or purchases. I believe Bell sold out of our real estate or REIT positions in early 2022. What are your thoughts about real estate at the moment?
Slide 17: Real Estate: Residential
33:28 Ryan Kelley: From the publicly traded stock market perspective, real estate investment trusts or REITs are actually a very small part of it. It’s a few percent so there isn’t much importance directly. But if you look broader, at the value of real estate, mostly privately held is enormous and has a lot of economic effects. So it’s not a direct stock market effect, but it does have a lot of economic implications.
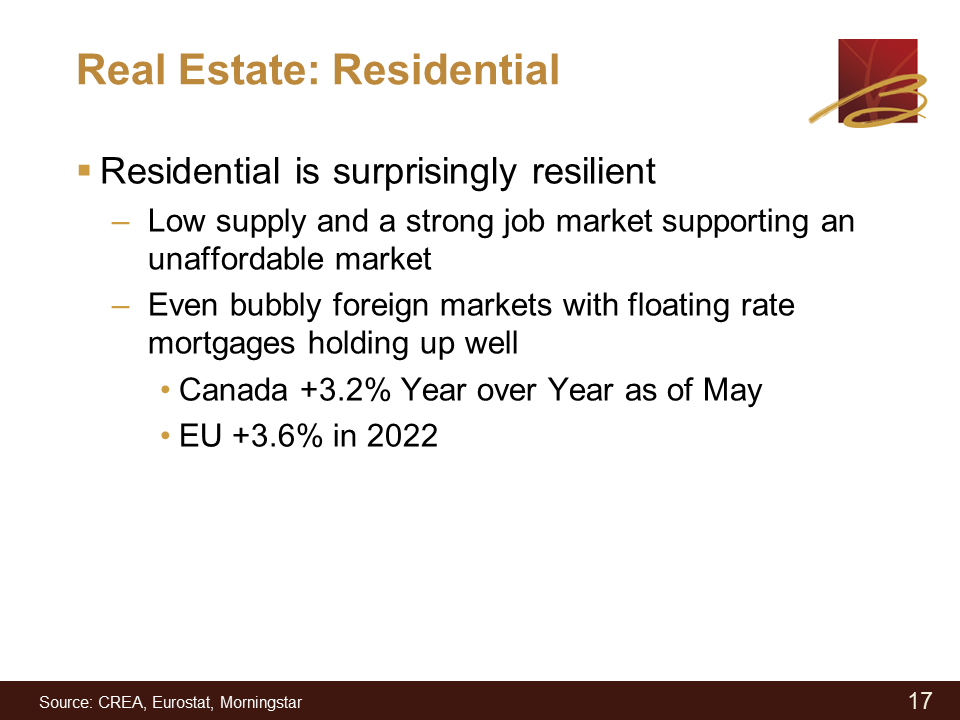
33:55 So first, I’ll start just discussing residential. Residential real estate is very unaffordable right now. The run up of post-COVID ran the prices up and then we had the Fed raise interest rates, which jacked up mortgage rates, and the combination has driven down affordability to really low levels. But despite that, it’s actually been surprisingly resilient. And the reason for that is just low supply. Not a lot of people are listing their house, especially if they locked in a sub 4% mortgage rate. They’re not in a hurry to recycle that and sell and go take out a new loan somewhere so people just really aren’t listing houses.
34:40 The strong job market also is reducing the amount of forced sales, where someone loses their job and has to relocate and needs to put their house on the market. There just hasn’t been a lot of that since most people are staying employed. And I think probably what’s even more surprising with the residential side is that if I look abroad, where there’s also been similar to what we see locally, where there’s been a huge run up in prices in the past 10 years, these types of markets mostly have floating rate mortgages. The U.S. is an outlier with long-term, fixed-rate mortgages. But even with existing holders of real estate, where they have these floating rate loans and do suffer when rates go higher, and rates have gone higher, by the way. There’s a lot of central banks around the world that have mostly been raising interest rates in the past 12 months. One example is the European Union. Prices are not at their all-time highs. A lot of most cases they have to come down somewhat but they’ve actually started re-accelerating while their own central banks keep increasing interest rates, which to me is a remarkable sign of resilience to these really unaffordable markets.
35:55 Laurent Harrison: Alright. What about commercial?
Slide 18: Real Estate: Commercial
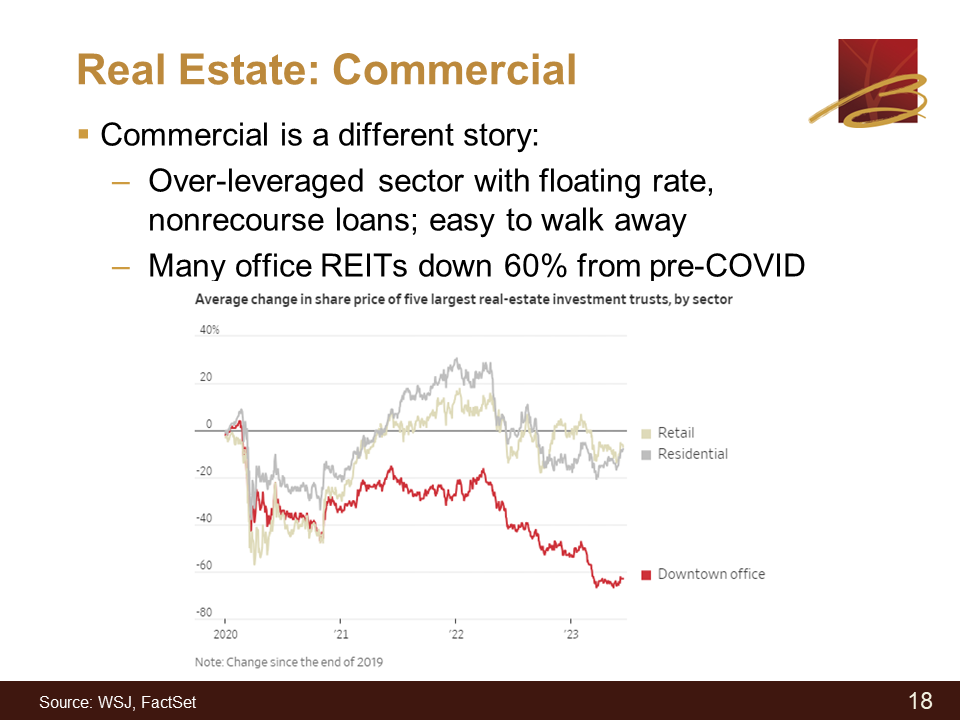
36:01 Ryan Kelley: The commercial is where we see more of a divergence compared to residential. You’ll see from the chart below that commercial itself can be divided into many different subcategories: warehouses, residential real estate. There’s even a cell phone tower real estate, publicly traded REIT. But overall, it hasn’t held up nearly as well as residential. You can see by the chart, downtown office spaces has been the worst but even the retail residential, it’s still lower than where they were pre-pandemic. There’s also a lot of private real estate which is slowly being written down but it’s somewhat resistant to that. But over time, that’s kind of a slow-moving event.
36:45 Part of the reason for this is that the sector got very over-leveraged. Debt is usually a floating rate, or at least it’s a shorter-term loan that then has to be rolled over at a certain point. There’s some type of interest rate protection that needs to be rolled over. And that’s creating a lot of financing pain. It’s also a lot easier to walk away because if I have a portfolio of buildings, and one is not doing well, pretty much in every case, the loan I’ve taken out is restricted just to that property. If I default on it, it doesn’t affect any of my other buildings. So it’s very easy to make a business case for turning back the keys to the bank on specific trouble properties and still holding on to the better-performing ones.
37:31 The only other point I’d make here is that you mentioned we had sold out of REITs. That didn’t affect every account but we had some REIT exposure. We sold out in I want to say it was January of 2022. If you look at the below chart, you can see that was one of the near-term highs of real estate. And then once interest rate cycle started going into full swing you saw values just start to become under pressure. Luckily, we were able to avoid all of that.
38:01 Laurent Harrison: Got it. Alright. It sounds like from a real estate perspective, residential real estate is surprisingly resilient. Its prices are staying high, at least in maybe those popular areas. And commercial real estate though is looking a bit challenging at the moment with office REITs of any kind, given the pandemic tendency for folks to still work from home etc. So doesn’t sound like we’re going to be necessarily investing any time soon with client portfolios, at least in any kind of office REITs. That’s what it sounds like.
38:42 Ryan Kelley: At least not on any major level, no. There’s always some de minimis amount of exposure in the funds, but it’s not meaningful.
38:52 Laurent Harrison: Got it. All right. Well, those were really great topics to cover today. We are out of time.
Slide 19: Summary
39:01 Laurent Harrison: So I’d like to do a quick conclusion in summary of what we’ve talked about today. Number one, the stock and bond markets have recovered well so far this year from a negative and volatile 2022. The current strength in U.S. markets, however, comes from a narrow band of tech consumer and communication stocks. So, Ryan does have a little bit of a concern that narrow rally is really contributing most of the positive upward [trajectory] on the index and there’s a whole lot of stocks in the index that are basically flat to negative. Whether that turns into a bigger rally for the rest of the market or ends up being very narrow, that is a bit of a concern that we have. We learned a lot more about inflation, the Fed and where inflation was last year and the fact that it’s moderated from its high back in 2022. Unfortunately, the Fed is planning two more hikes in 2023. And I believe that’s a change from what the market was expecting earlier this year. So that’s probably not going to have necessarily a strongly positive effect on bonds or stocks, unless I guess we see the Fed kind of telegraphing that that’ll be the last two hikes that we have for a while. Is it fair to say, Ryan, maybe a little bit more volatility in 2023?
40:29 Ryan Kelley: Yeah, I think that’s fair to say. I mentioned how the pros’ estimate of a recession keeps getting pushed out six months. That may still happen. We know at some point a recession is inevitable. So, whether that happens in the next six months or not. We do know eventually it will happen and volatility will likely pick up once that finally occurs.
40:51 Laurent Harrison: So good to have some bonds in your portfolio and obviously some cash in your savings account, in addition to your longer-term stock portfolio. If you do have any questions based on the topics today or any concerns, we of course recommend that you reach out to your Bell advisor or relationship manager. Schedule a meeting or give us a phone call. Obviously if things are changing with your financial plans this summer or you’ve decided to maybe do some extra vacations, give us a call regarding your spending needs.
41:23 And of course, we do wish you all a great start to the summer and congrats to all the graduating seniors out there.
Slide 20: Have Questions?
41:32 Laurent Harrison: If you did have questions, please do submit those questions in your box on your screen. We’ll do our best to respond to you quickly after the webinar is complete.

Slide 21: Stay in Touch!
41:44 Laurent Harrison: And then the last slide before calling the end of our presentation today is we’d love for you to stay in touch. You could do it a couple of different ways via our website. You can sign up for an e-newsletter or you can email us (your advisor or your relationship manager) or give us a call. Just a last note that today’s presentation slides are available upon request. We appreciate you listening today. And I think that’s it for me. Ryan?
42:11 Ryan Kelley: Yes. I just wanted to thank everyone for tuning in. Hopefully, you guys found it informative.