
Often times too much of a good thing can be bad. I thought of this adage as I sat in the sweltering heat of a Memorial Day celebration in California’s Central Valley. I love being outside on warm, sunny days. 60 degrees is too cold. 70 degrees is better. 80 degrees is just right. 90 degrees is a bit uncomfortable. Triple-digit temperatures are punishing. As the day wore on, I applied this wisdom as I surveyed the cooler of drinks. An ice-cold beer sounded refreshing. And while a second would likely cool me down even more, too many beers would cause dehydration and make me feel even worse.
I also happened to be in a location that was hit hard by the housing crisis. The town I was in boomed in the early-2000s as new housing units sprouted like the summertime crops that once covered the land. The population jumped, housing prices soared, big-box stores opened, and new schools were built. Of course, we know how that ended. The boom was not backed by organic economic growth, but by cheap debt, which, like beer and sun, can result in too much of a good thing.
Just ask Greece. From 2001 — when it first adopted the euro as its currency — to 2008, Greece’s budget deficit averaged 5% of economic output per year compared to an average of 2% for all Euro Zone nations. By 2009, that budget deficit ran as high as 13%. To fund these large annual spending deficits, Greece took on more and more debt; by 2009 debt owed to lenders outside of the country totaled 115% of annual economic output. The debt that had been accumulated came with enticingly cheap interest rates, thanks to Greece’s membership in the European Union. Essentially, bond investors granted a similar interest rate to Greece as they did to stronger countries like Germany that were financially healthier and more stable. They did this because the countries were members of the same monetary union — the thought being that the healthier nations would financially back the weaker ones to maintain stability.
That thinking began to change in 2008 with the result being a growing divergence between Greece and Germany’s cost of borrowing. This development became meaningfully worse in early 2010 when it was discovered that Greece was significantly underreporting the size of its budget deficits. As a result, Greek interest rates spiked to the point that the cost of rolling over their massive debt load was potentially crushing to their economy without outside assistance and internal reform. This, in a nutshell, is what sparked the European credit crisis.
Given what transpired in Greece economically in recent times, it is ironic that the great philosophers of ancient Greece seemed to grasp the concept that too much of a good thing is not always desirable:
Excess of liberty, whether it lies in state or individuals, seems only to pass into excess of slavery.
— Plato,The Republic
It is the nature of such things to be destroyed by defect and excess as we see in the case of strength and of health. Both excessive and defective exercise destroys the strength, and similarly drink or food which is above or below a certain amount destroys the health, while that which is proportionate both produces and increases and preserves it. So too is it, then, in the case of temperance and courage and the other virtues.
— Aristotle, Nicomachean Ethics
Throw moderation to the winds, and the greatest pleasures bring the greatest pains.
— Democritus
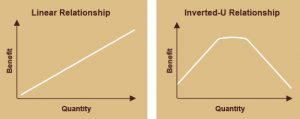
Inverted-U Curves
In his latest book, David & Goliath, author Malcolm Gladwell discusses the concept of inverted-U curves in an attempt to prove that more of something is not always better as a linear relationship would suggest. In providing an intuitive example, he writes:
A classic inverted-U curve can be seen in the relationship between alcohol consumption and health. If you go from not drinking at all to drinking one glass of wine a week, you’ll live longer. And if you drink two glasses a week, you’ll live a little bit longer, and three glasses a little bit longer still — all the way up to about seven glasses a week. (These numbers are for men, not women.) That’s the upslope: the more, the merrier. Then there’s the stretch from say, seven to fourteen glasses of wine a week. You’re not helping yourself by drinking more in that range. But you’re not particularly hurting yourself either. That’s the middle part of the curve. Finally, there’s the right side of the curve: the downslope. That’s when you get past fourteen glasses of wine a week and drinking more starts to leave you with a shorter life. Alcohol is not inherently good or bad or neutral. It starts out good, becomes neutral, and ends up bad.
Despite the ease of understanding inverted-U curves and the idea that there can be “too much of a good thing,” human beings often apply linear relationships to their thinking and policies. Bigger education budgets and smaller class sizes equate to better schools. More government oversight and regulations mean a safer economy and less volatile financial markets. More money results in greater happiness. Assuming a linear relationship suggests that more of the former always means more of the latter, but as evidenced by the examples above (and numerous more in Gladwell’s book), that often proves not to be the case.
In fact, in a 2011 paper entitled “Too Much of a Good Thing: The Challenge and Opportunity of the Inverted U,” which appeared in Perspectives on Psychological Science, professors Adam Grant of the University of Pennsylvania and Barry Schwartz of Swarthmore College contend that it is possible that everything follows an inverted-U curve. They write:
Our purpose in this article is to draw attention to what may be a fundamental and ubiquitous psychological principle: There is no such thing as an unmitigated good. All positive traits, states, and experiences have costs that at high levels may begin to outweigh their benefits, creating the non-monotonicity (i.e. non-linear relationship) of an inverted U.
While I do not intend to spend the remainder of this paper debating whether the benefits of all things follow an inverted-U curve, the lesson I hope to impart is that we should at least consider the possibility that an inverted-U relationship exists when examining data. In contrast to a linear relationship, assuming an inverted-U curve relationship suggests that more is better for a period of time, followed by a period of diminishing returns when more does not make much of a difference, followed by the final period (i.e. the downslope of the curve) when more actually makes things worse.
Linear Relationships in Retirement Planning
At Bell Investment Advisors, retirement planning is a process that begins with clients defining their view of retirement. This definition includes the quantitative (i.e. retirement date, annual spending budget) and the qualitative (i.e. what retirement means to them, what they want to do and/or accomplish in retirement). The next step in that process is to take inventory of their financial resources and work to gauge the likelihood of that vision’s success, which typically means not running out of assets during the course of the clients’ lifetimes. (The other typical definition of success is passing away with a certain amount of assets left for heirs and beneficiaries.)
The tool we use to gauge the probability of success of a retirement plan is a Monte Carlo analysis. In this type of analysis, return paths are randomized and the client’s plan is put through thousands of different scenarios. The end result is a certain number of return paths that are successful (i.e. money in the bank at the time of death) and some that are unsuccessful (i.e. money runs out prior to death). From these results, we can calculate the plan’s probability of success as the number of successful scenarios divided by the number of total scenarios we ran. Ideally, we like to see plans with a probability of success at least in the 70% range, but ultimately the acceptable figure is up to the client based on their level of comfort with the degree of uncertainty in the plan.
Within the Monte Carlo analysis, there are some variables that possess linear relationships with the probability of success of the plan. For example:
- Total Assets: “The more, the merrier” as Gladwell says. Each dollar of assets contributes positively to the probability of success of your plan.
- Living Expenses: The more you can reduce your annual living expenses in your plan, the more the probability of success increases.
- Duration of the Retirement Plan: With each year that you shorten your retirement, the probability of success increases. This can be accomplished by either working longer or by lowering the mortality age.
The total asset variable has a positive linear relationship with plan success (i.e. upward sloping line). The other two have negative linear relationships (i.e. downward sloping line), which means decreasing them improves the success of the plan. Regardless of the slope, each of these variables possesses a linear relationship with plan success — more (or less in the case of the negative linear relationship) is always better.
Inverted-U Curves in Retirement Planning
With retirement planning, it is often assumed that the risk of one’s investments and the probability of success of one’s plan also follow a linear pattern. This relationship suggests that the more risk an investor takes the higher their plan’s probability of success will be due to the higher expected return from riskier investments. This holds true some of the time but not all of the time. The determining factor is how aggressive a plan’s underlying retirement goals are.
Take, for example, a 55-year old client who wants to retire immediately. He has $1,000,000 in retirement assets and wants to produce $60,000 in annual inflation-adjusted income from the portfolio until he is 90 years old. Those are aggressive goals: 1) early retirement, 2) long retirement (35 years), and 3) a high draw rate (6%). The probability of his path follows a linear pattern — the more risk he takes, the higher the probability of success of his plan.
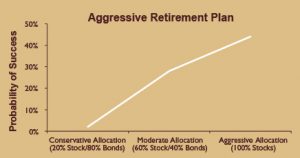
The most conservative portfolio fares the worst, and the most aggressive portfolio fares the best. As the portfolio’s risk increases, there is no point at which his probability of success begins to decline. The reason is that because his retirement goals are so aggressive he needs the risk and the higher expected returns that accompany it. A 100% stock portfolio gives him the best chance of succeeding because it is the allocation most capable of producing the high growth rate necessary to make this plan succeed. (It should go without saying, but with a maximum probability of success of 44%, we would never endorse this retirement plan.)
Now take, for example, a 65-year old client who wants to retire immediately. She has $1,000,000 in retirement assets and wants to produce $45,000 in annual inflation-adjusted income from the portfolio until she is 90 years old. In terms of the draw rate and the duration of her retirement, those are much more conservative goals, and this is the scenario in which the inverted-U curve comes into play. The more risk she takes the more the plan improves, but only to a point. Once she starts investing in high-risk allocations, the probability of success of her plan actually begins to worsen.
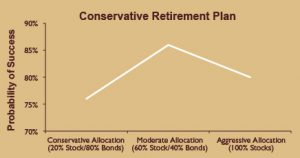
The reason an inverted-U curve shows up in this scenario is because of the retirement plan’s conservative assumptions. She needs some risk to maximize the plan’s probability of success, but she achieves that (86%) with the moderate allocation. The aggressive allocation brings with it a higher expected return, but it also brings greater risk in the form of higher volatility and larger potential losses. Unlike the aggressive retirement plan, the conservative plan does not need as much return as it can get to work. It has sufficient returns at the moderate risk level. Beyond that, the additional expected return of the higher-risk allocations do not compensate for the added risk.
(For what it’s worth, all of these allocations pass the test, but we would recommend the moderate allocation because it maximizes the plan’s probability of success with the least amount of risk. In finance-speak, it is the most efficient risk allocation. In layman’s terms, don’t take more risk than you need.)
The Problem with Target-Date Funds
Though first introduced by Barclays Global Investors in 1993, target-date (a.k.a. lifecycle) funds have grown significantly in popularity and use over the last eight years, especially within 401(k) plans. According to Morningstar, target-date funds — which had less than $100 billion in assets as recently as 2006 — had over $600 billion in assets at the end of 2013. And as of the end of 2012, 41% of 401(k) participants owned target-date funds according to the Investment Company Institute and the Employee Benefit Research Institute. That figure is up from 19% in 2006.
The appeal of target-date funds is their simplicity. Target-date funds work by immediately diversifying you among a pool of stocks, bonds, and cash, and then by gradually decreasing your risk over time as you approach your retirement (i.e. your target date). This is accomplished by reducing the equity exposure and increasing the bond/cash allocation. It is retirement investing on auto-pilot.
However, sometimes things can be made to be too simple. The generic path of risk reduction inherent in target-date funds is problematic because, as illustrated above, it does not make sense for every investor to be decreasing risk as he or she approaches retirement. The investor with the aggressive set of retirement assumptions should actually be increasing risk in hopes of higher expected returns that give their plan a better chance of succeeding. Target-date funds actually weaken the retirement plan for this type of investor.
While target-date funds fit the needs of investors with conservative retirement assumptions by decreasing risk as they approach retirement, they fail to acknowledge that every investor’s inverted-U curve is different. In the “Conservative Retirement Plan” example above, the investor’s optimal allocation was 60% stocks and 40% bonds. That optimal allocation was a function of that investor’s specific goals and not a one-size-fits-all model. Change the assumptions and the optimal allocation likely changes as well.
Investors within target-date funds will have the same allocation at retirement as everyone else who retires that year, but the specific allocation varies wildly among target date funds. We surveyed 21 target-date funds designed for investors retiring in 2015. While the average allocation was 46% stocks, 50% bonds, and 4% cash, the high and low allocation for each asset class was miles apart. The stock allocation ranged from a low of 27% to a high of 57%. The bond allocation ranged from a low of 33% to a high of 69%. Some funds carried no cash; others held 10% — a significant drag on the portfolio’s performance when cash yields nothing (as it does today).
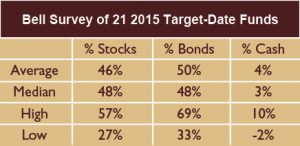
The fund claiming the lowest stock allocation is the Wells Fargo Advantage DJ Target 2015 Fund. Its allocation is 27% stocks, 69% bonds, and 4% cash, and it is a popular target-date fund with almost $1 billion in assets under management. We tested this fund’s allocation on our aggressive and conservative retirement plans that we presented earlier in the paper. Here are the results:
- Aggressive Retirement Plan = 3% probability of success
- Conservative Retirement Plan = 76% probability of success
With this allocation, the retirement plan with the aggressive goals has essentially no chance of working. And while the plan with the conservative goals has a passing grade of 76%, it is at the bottom of its inverted-U curve. The plan could have a meaningfully better chance of success (86%) if the allocation was changed to 60% stocks and 40% bonds.
Conclusion
As demonstrated, the relationship between risk, return, and the probability of success of your retirement plan may be linear or it may follow an inverted-U curve; it depends on your specific goals. Everyone has a target date for retirement as well as a target return and risk level that maximizes their plan’s chance of success. To find the optimal portfolio, investors need custom, personalized advice that is tailored to them and their circumstances, not one-size-fits-all models. Target-date funds are designed to make the job of investing for retirement effortless, but too much simplicity clearly has its drawbacks.