
-
Stock & Bond Market Commentary
-
Global Economic Update
-
Inflation Concerns & the Federal Reserve
-
Are Stocks Expensive?
2024-25 Bell Webinar
Markets, Inflation, and the Fed
Speakers:
Laurent Harrison, CFP®: Senior Investment Advisor, Financial Planner
Ryan Kelley, CFA®: Portfolio Manager
This transcript has been edited for clarity.
Slide 1: Markets, Inflation, and the Fed
00:00 Laurent Harrison: Hello! Welcome to today’s webinar on markets, inflation and the Fed. It will last approximately 30 minutes. We very much welcome all of you, Bell clients, to our presentation.

Slide 2: Presented by
00:13 Laurent Harrison: My name is Laurent Harrison, Senior Investment Advisor and Financial Planner. I’m joined today by Ryan Kelley, Lead Portfolio Manager and Research Analyst for Bell.
00:21 Ryan Kelley: Hi! Happy to be here.
00:23 Laurent Harrison: Today we’re going to present a webinar entitled “Markets, Inflation, and the Fed.” We will be focused on several topics that we hope are of interest to you. If you have a question, however, please submit it via the question bar. While we’re not answering them on the webinar today, for time’s sake, we’ll follow up individually with you after the presentation. Also, a recording of today’s webinar, along with a transcript, will be posted to our website within 48 hours and the slides are available on request.
Slide 3: Agenda
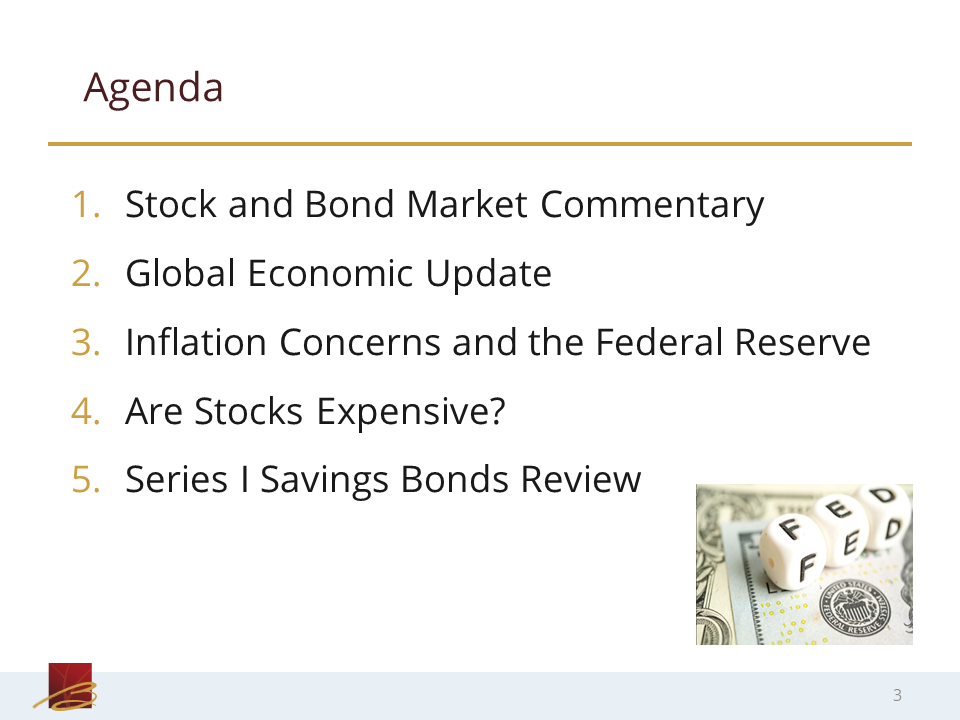
00:59 Laurent Harrison: On the agenda today, here’s a little bit more detail. We’re going to cover just a little bit from 2023 through year-to-date 2024 on both stock and bond markets. Ryan is going to talk about the global economy and what’s going on both here and abroad. We’re going to get into inflation concerns and the Federal Reserve, which has been a really hot topic this year. And then Ryan is going to finish up with “Are stocks expensive?” and answer that question that’s been also in the news and popular among folks looking at the current market.
01:38 Laurent Harrison: Then, I will finish up with a summary of today’s webinar as well as touch upon Series I Savings Bonds, which were a really hot topic at the beginning of last year. Not so hot today. Ryan, why don’t I pass it over to you?
Slide 4: 2023: U.S. Market Performance
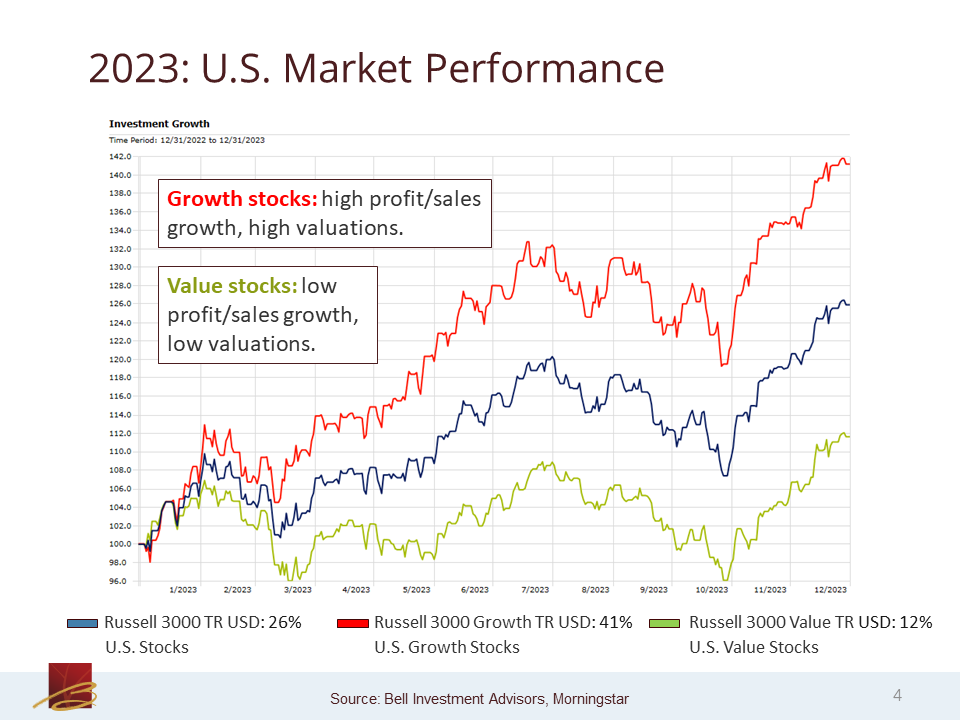
01:55 Ryan Kelley: Great. Thank you. Here we’re looking at a chart of 2023. There’s three lines here, so let me explain them. The blue line is the Russell 3000, which is representative of the overall U.S. stock market. These are total return numbers. The red line is the same (U.S. stock market) but a growth version of that, and the green line is a value version of that. As you can see, the red line (or the growth stock version of the U.S. market) dramatically outperformed the value version last year.
02:35 Ryan Kelley: But what I’d like to point out is a lot of this is a reversal of the losses that were seen in 2022. There was a time in 2022 that I believe the growth stock index was actually down 30%. I know the overall U.S. market was down 20% because at one point we were saying we’re officially in a bear market. The value stock index did lose money in 2022, but it wasn’t that much. So, turn the page towards last year and we saw a complete reversal of that. The growth stocks that lost a lot of money rebounded quite sharply. Things that didn’t lose that much money, including value stocks, rebounded still up double digits, but not nearly as much because they never fell that far to begin with.
03:29 Ryan Kelley: So last year was obviously a stellar year, but a lot of it was also a recovery of losses that were experienced in 2022. Additionally, towards the end of the year, there was also a pretty sharp rally. Some of that was due to interest rates falling, and some of that was actually due to a new mania or hype surrounding artificial intelligence. That kind of happened in the middle of October. But sometime in October was the bottom and you have this sharp recovery, even beyond that last year.
Slide 5: YTD U.S. Market Performance
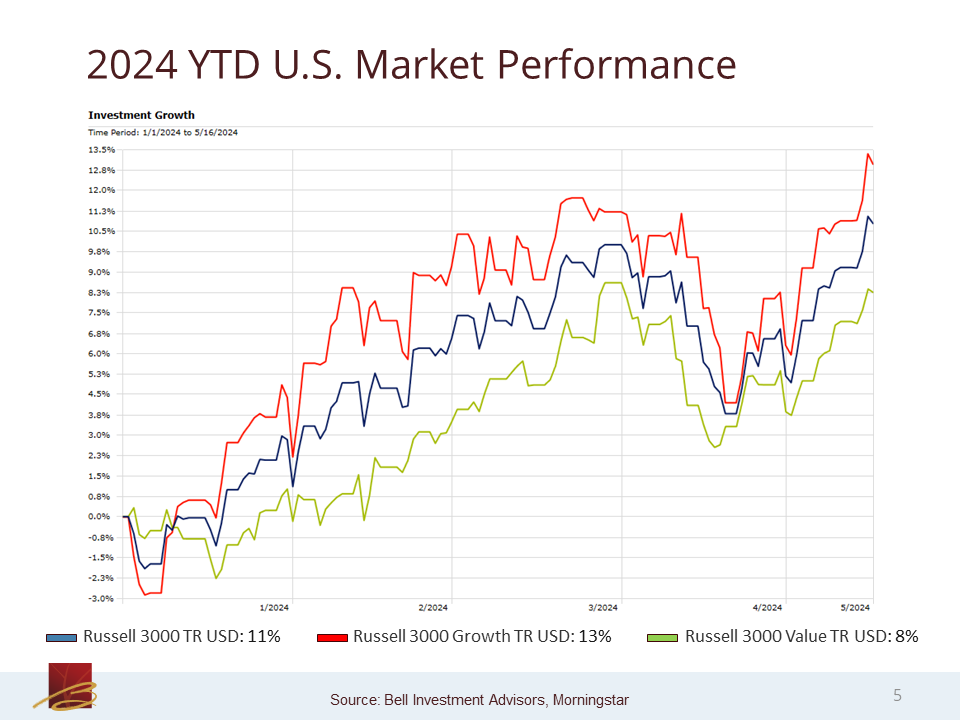
04:07 Ryan Kelley: As we turn to the next slide, we’ll see year-to-date performance (the same three indices). This is ending as of May 16. And you’ll see the same ordering of “Best to Worst,” so growth stocks this year have been the top performer as they were last year and value stocks the laggard. But the spread is not nearly as wide compared to what we saw last year. It’s been 5% “Best to Worst” and you can see the overall index again in blue with the Russell 3000 up about 11%.
04:48 Ryan Kelley: What’s interesting this year is [that it] hasn’t just been a growth stock story. There have been certain sectors which are definitely not perceived to be growth sectors, [that have done well]. For example, utilities has had a very hot year, mostly concentrated in the last 30 days or so. Energy has had a really great year, too. So, it’s not just the “tech beating everything” story this year. Tech has done well. But there are other non-tech, growth areas which have also done well. That’s helped some of the differential between growth and value shrink.
Slide 6: 2023: Global Equity Performance
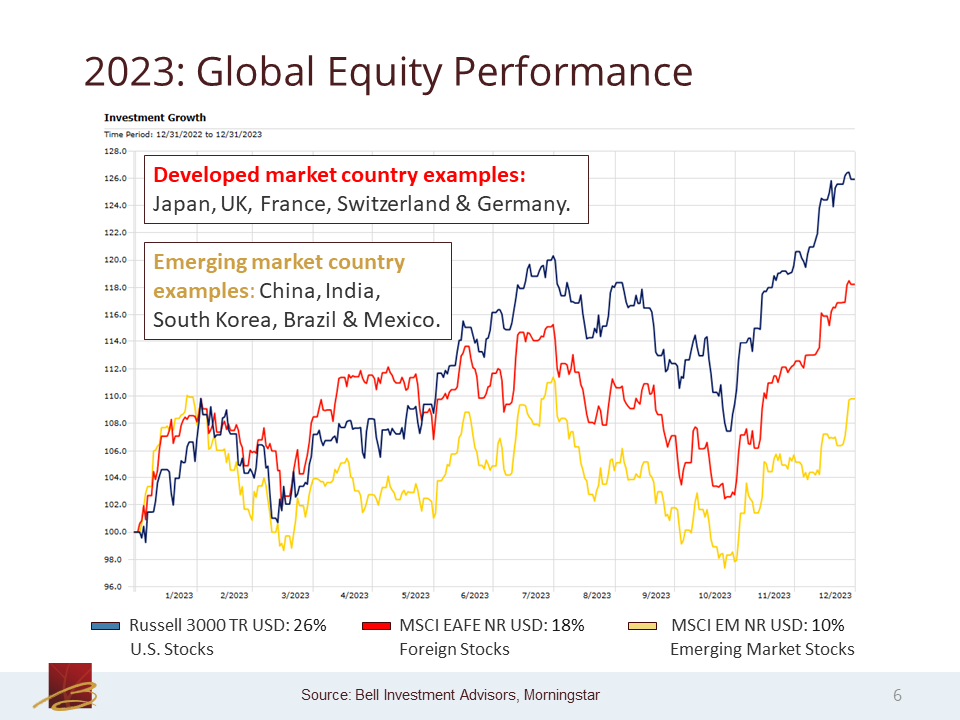
05:29 Ryan Kelley: We go to the next slide and we’ll see U.S. versus foreign markets. Again, we’re using the same blue color for the Russell 3000 to represent the U.S. market. The red line is the MSCI EAFE, which is the index of developed market foreign stocks. And then the yellow line is the MSCI Emerging Markets index (emerging market stocks). It’s a similar story we saw: growth versus value. The U.S. stock market in 2022 did worse than foreign markets. In the same way we saw then, growth stocks rebound in 2023 relative to value. We see this effect again here with U.S. stocks rebounding harder relative to foreign stocks, which at least for the developed market perspective, held up better in 2022. Again, the things that got hurt the worst rallied the hardest last year in the same pattern you can see here.
06:35 Ryan Kelley: But I would point out that, even though international stocks didn’t do as well last year, you still had almost 20% earned from developed international investments, which is hardly a bad return. Even the worst on here still achieved double-digit returns with emerging markets. So really, these are all great returns that were achieved last year.
Slide 7: 2024 YTD Global Equity Performance
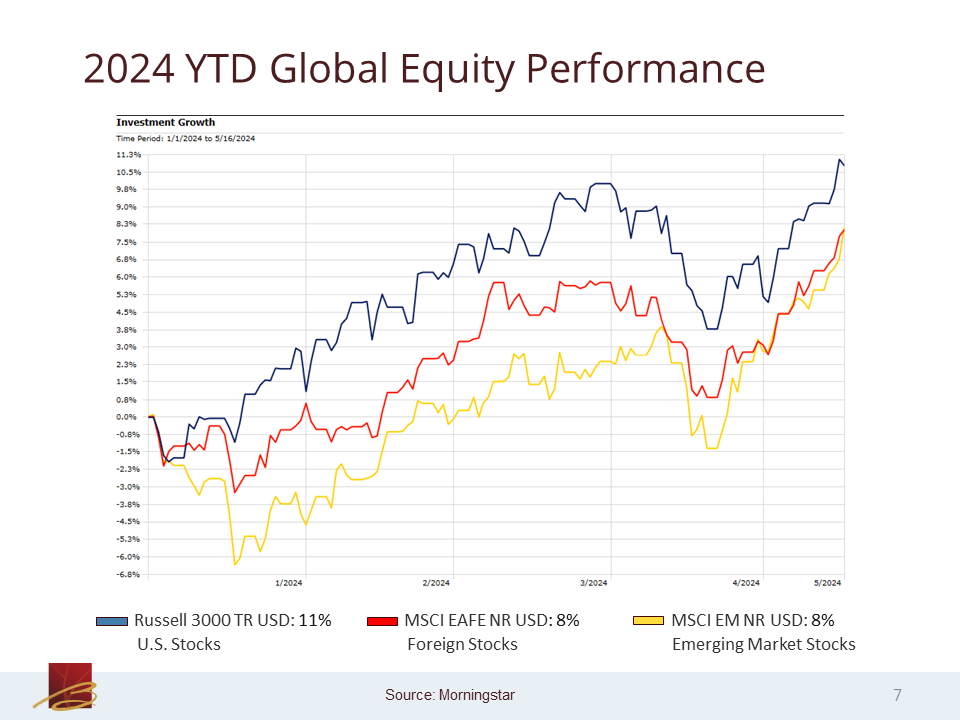
07:01 Ryan Kelley: Now if we fast forward to what’s happened this year so far, again ending on May 16 and the same colors, same indices. We’ll see again, just like we saw with growth versus value from a U.S. perspective being in a much tighter range. We see the same order and less spread here. So U.S. stocks have outperformed their foreign counterparts year-to-date but at less of a differential, about 3% spreads. The other thing I point out here is that you can see that, for most of the year( again in yellow), emerging markets really lagged the other two benchmarks on here. But you can see that starting around mid-March, there was a really sharp rally with emerging markets and that was really coming out of China. The Chinese stock market really has rebounded quite sharply in recent times and that’s actually led them to completely close the gap.
08:00 Ryan Kelley: You can’t really see on this chart, but if I opened up some more decimal points on that 8% versus 8% return year-to-date, you’d actually see emerging markets had slightly beaten their developed market peers so far year-to-date. And again, they’re only lagging the U.S. by about 3% or so, sohis is really a much more healthy dynamic. It’s not just U.S. growth stocks trouncing everything or previously in 2022, really underperforming everything. It looks like a broader, healthier rally both domestically and abroad as well.
08:37 Laurent Harrison: Hey, Ryan, just one quick comment. Some of our clients have asked the reason for the rally, since that mid-October or late-October time period last year. Because it looks like a lot of what we saw last year, kind of the start of that recovery seems to be continuing, if you will, in 2024. And I know you’re going to talk about inflation and interest rates right after this slide. Would you say that the recovery is really a direct reflection of Powell and the Fed stating that they’re not going to raise interest rates, or do you think there are other factors contributing to the stock rally at the moment?
09:21 Ryan Kelley: So if I go back to October of 2023, if memory serves me correctly, the yield on the 10-year U.S. Treasury bond hit almost 5% And that was at the peak of pessimism. Since then, it started falling and the enthusiasm for lower yields helped boost stock prices as well as this sudden news of Chat GTP and artificial intelligence, etc. coming out, also adding some enthusiasm and causing markets to rally.
10:00 Laurent Harrison: Got it. Okay.

Slide 8: 2023: A Recovery For Bonds
10:04 Ryan Kelley: Let’s turn our attention to the bond market. I know there’s a lot of lines [on this chart]. I’ll explain things here. We’re looking again at 2023 to start. The line that’s blue and kind of straight like a ruler, that’s Treasury Bills. This is assuming you had just rolled over short-term Treasury Bills over and over and over again. And since it’s so short, they have almost no principal fluctuation. If you had done that, you would have ended the year slightly above 5%.
10:32 Ryan Kelley: If you had invested in more traditional bonds, you can see from the lines you would have had principal fluctuation. So orange [represents] long-term bonds, yellow intermediate-term, and green are short-term bonds. The more maturity, the more fluctuations. I think the scale of the chart does make it seem perhaps like more of a wild ride last year, but there were times where long-term bonds were up 7-ish percent, and also down almost 10%, and ended the year the best performer of these five options, up 7%. The overall U.S. bond market in red ended up about 5.5%, so slightly beating Treasury Bills and beating short-term bonds and actually beating intermediate term bonds as well. So, you had a lot of the returns clustered in the 5-ish percent, the laggard being short-term bonds a little bit and then long-term bonds, adding about 1.5% over the overall bond market. Last year was a healthy year, good for bond investors, which is a complete reversal from what we saw in 2022. That was a very painful year for fixed-income investors, especially ones at intermediate or longer-term types of bonds. That was particularly painful in 2022. So we did have a decent [year], certainly not erasing prior losses, but at least we had a decently positive year in 2023.
Slide 9: 2024 YTD: Bond Prices Weakening
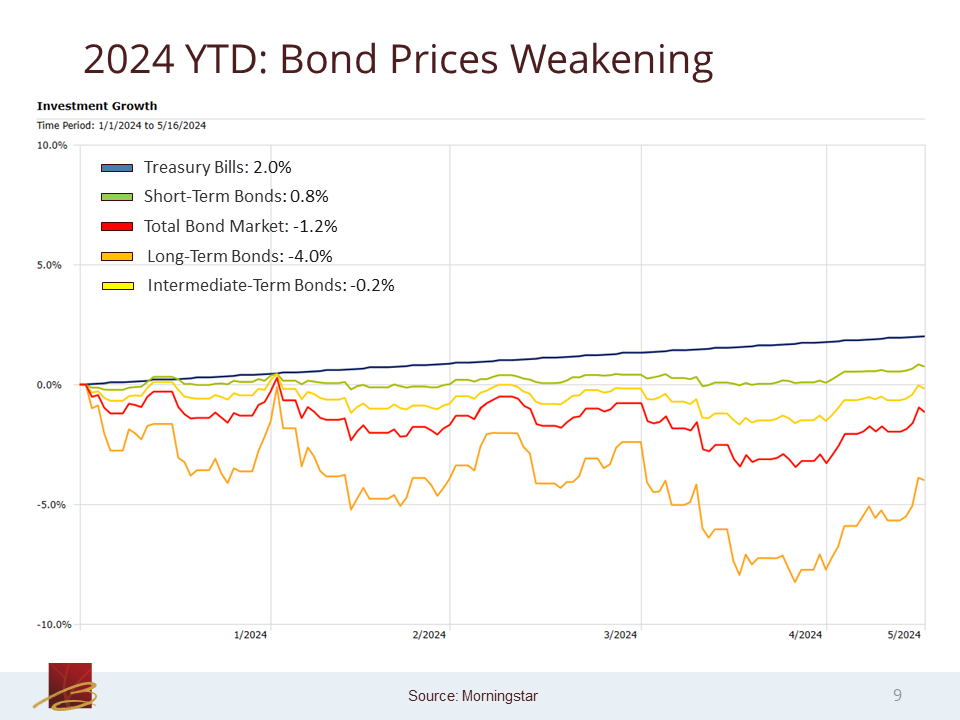
12:13 Ryan Kelley: If we skip ahead to year-to-date, there has been a slight, but not certainly not complete reversal, so far this year. Again, we’re seeing the same indices, the same colors. Treasury Bills since you simply earn income and there’s very little principal fluctuation. It looks like you laid down a ruler and drew a line. They are up about 2% this year. Short-term bonds have actually managed to log a slightly positive year-to-date return but most of that has come in the last month or so. If we did this six weeks earlier, I think it’d be either flat or slightly negative. And then as you extend out your maturities, you start getting small losses. Single-digit, but worst case, long-term bonds being down 4%. Your overall bond market being down about 1.2% right now. So, 2022 was awful. 2023 was good. This is certainly not an awful result. But there are some small losses on a total return basis. As interest rates have risen a little bit this year, the silver lining to this is that if interest rates simply went sideways (they didn’t go up or go down), the yield now on a lot of these investments is between 4.5% and low 5-ish%. If we think about that, cut that in half, because we have a little over six months left of the year, the coupons you’ll earn going forward will actually be enough to offset these losses, with the exception of long-term bonds. So interest rates don’t even need to fall, as long as they go sideways. Most of these numbers (if they’re not positive already), should convert as you receive coupons and receive them throughout the rest of the year. And flip these small single-digit losses into, hopefully, a positive return come December 31.
14:16 Laurent Harrison: So Ryan, I know some clients might question and say, “Gosh, I’m more heavily into bonds, maybe I’m not in as much stocks.” I’m assuming you would caution anybody [who is looking] to make any changes at the moment. In some of our investment committee meetings, you’ve said that bonds are actually pretty attractive at the moment in terms of those yields that you just mentioned. It does appear that the Fed has maybe slowed down and hasn’t raised any rates this year. And it looks like they could drop rates if there was the right kind of economy and the right kind of stability in our economy.
15:04 Ryan Kelley: I guess what I would say is, if we think about short-term bonds, typically there’s not a lot of principal fluctuation and so you’re getting mostly just interest income. And that really is Fed-driven over the short- and intermediate-term. Right now, on Treasury Bills, you’re getting around 5.25%. The Fed could completely change course and that could get cut down to something much lower. But if we’re talking intermediate or longer, you tend to get a rate of return that roughly matches your initial yield. So if I invest in what’s called an intermediate-term bond, I fast forward seven years, if my starting yield was somewhere around 5%. My ending rate of return, generally (there’s no guarantee on this) is going to look something like 5%. So the fact that we have much higher yields than we’ve seen pretty much at any time since before the financial crisis in 2008, to me makes bonds look pretty attractive.
16:17 Laurent Harrison: Right. Thank you.
Slide 10: Global Economic Report: Output
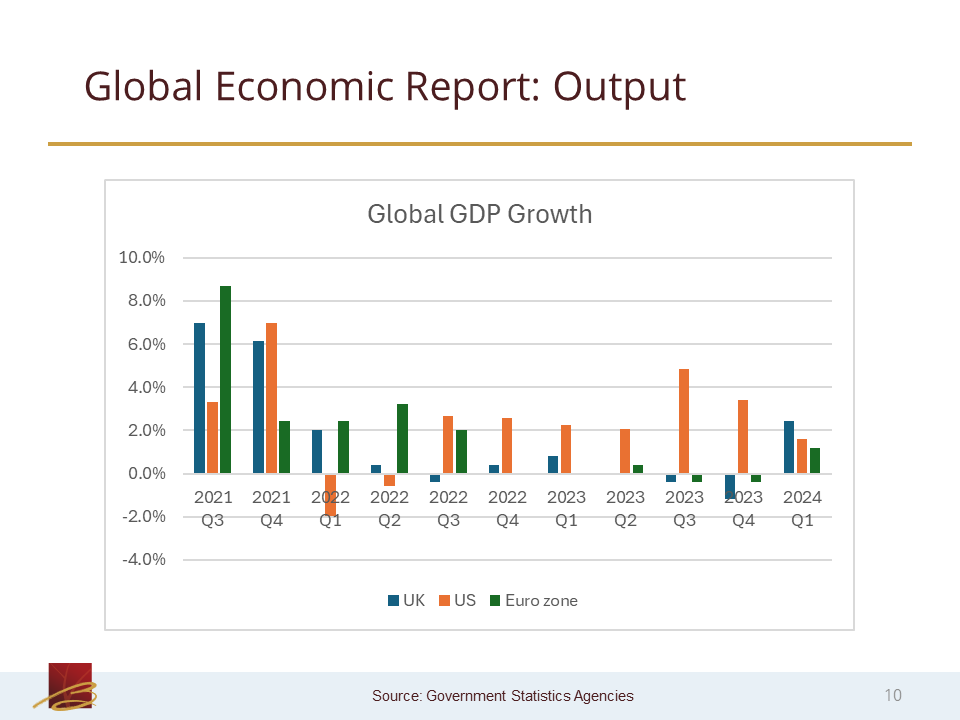
16:21 Ryan Kelley: If we turn our attention to the next slide, we’ll shift gears a bit and look at some economic data. What I’m showing here is the annualized rate of growth of different economies. I have the U.K. and U.S. [shown here]. The U.K. in blue, the U.S. in orange, and the Euro zone in green. If you look at the leftmost data, you see a lot of high-growth numbers. That’s due to a continued sharper recovery after the sharp losses we saw (a sharp contraction, I should say) from the pandemic. And then as you move towards the middle of the chart, and now to the right, you’ll see that a lot of those growth rates drop off, except for the U.S. in orange. You’ll see the U.S. has some decent quarter-after-quarter growth rates. In the first half of 2022, we actually had two negative results. But even that year, we still had positive growth. And for the rest of the time, we’ve had nothing but positive growth.
17:27 Ryan Kelley: That hasn’t been the same overseas. You can see some of these bars for the U.K., Euro zone almost don’t even show up and, in some cases, are actually slightly negative territory. Meanwhile, the U.S. has just been logging in economic growth quarter over quarter over quarter until we get to the very final data point. We see all three of them flipped to reasonably solid numbers. For the U.S. of recent times, it’s actually a little lackluster. The U.K. and Euro zone certainly better than they’ve been doing in recent quarters. And who knows if this will continue, but I can say, at least in this case, we’re finally firing on all three cylinders. We are seeing things be more balanced out, at least in the shortest of terms.
Slide 11: Global Economic Report: Jobs
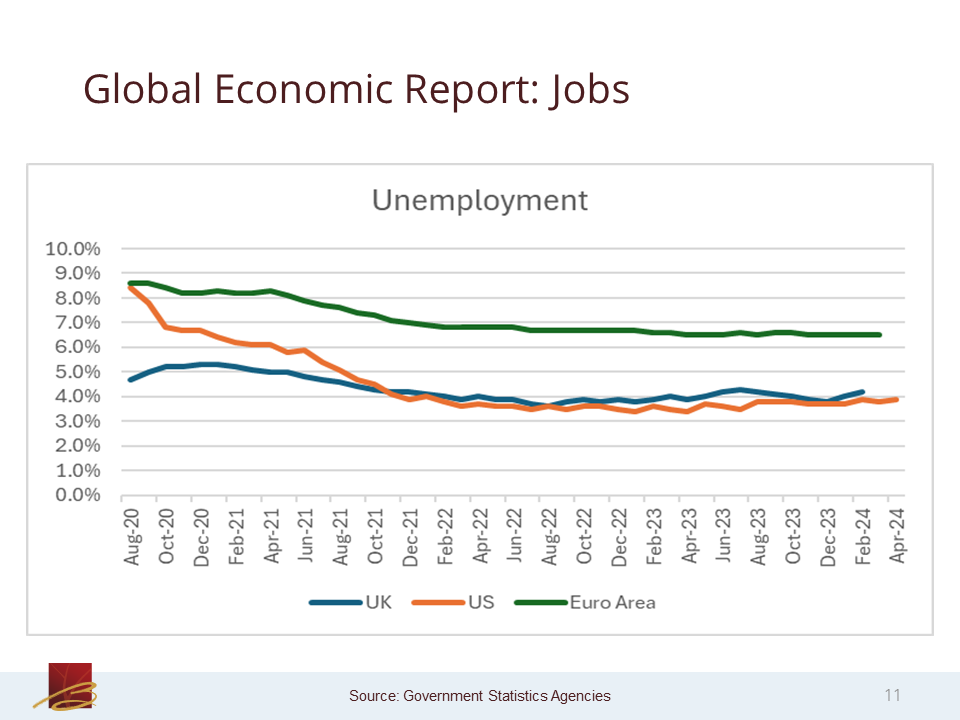
18:22 Ryan Kelley: On the next slide, we’ll look at things from an unemployment picture. What’s interesting is, you can see that other than again, the leftmost data (where we were still recovering from the pandemic and starting with high unemployment, which then shrank as the economic picture improved for all three of these economies)t, we really see a sideways half of, not improvement, but (in the U.S. perspective) really pretty close to full employment. And it’s interesting because, if you remember from the previous slide, unlike the U.S. some of these other economies like Euro zone actually had some outright negative quarters but it doesn’t really appear in this data. You see pretty much consistent flat, indicating something like full employment for the various economies. That’s continued on, and there really isn’t any deterioration from an unemployment perspective.
Slide 12: Inflation Trending Lower – Still High
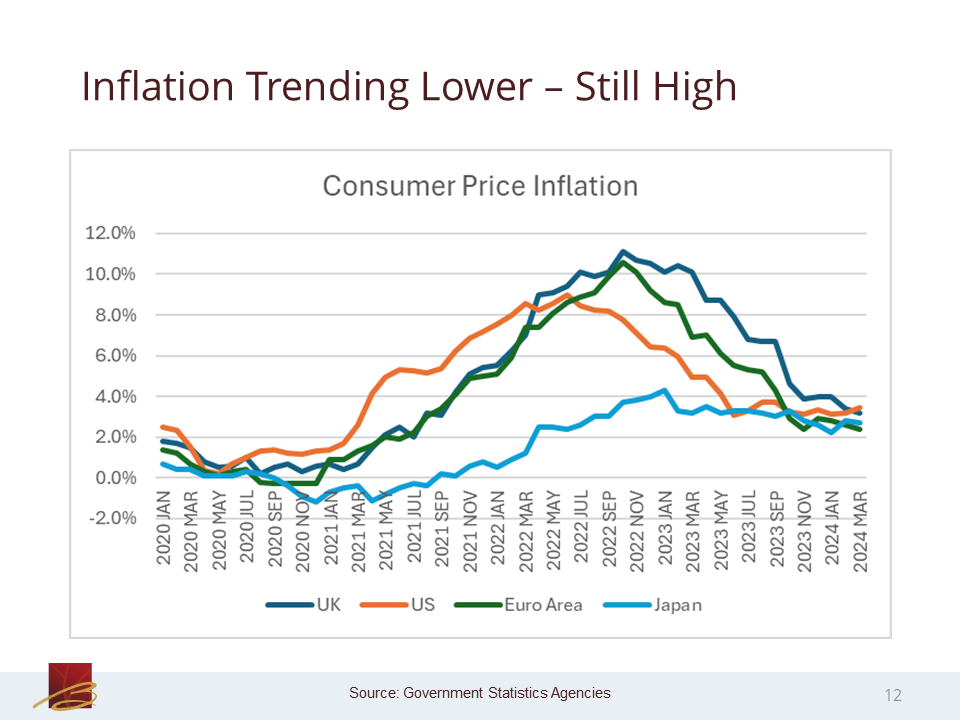
19:27 Ryan Kelley: And then on the final economic slide, probably the hot topic of the day is really inflation. So I’ve actually added Japan to the mix. They’ve always been a bit of a weird case ever since their asset bubble popped around the end of the ‘80s. And you’ll see Japan actually had outright deflation, so negative price growth around early 2021. The inflation that we had in the U.S. was a global story. So you can see that all these countries had inflation. It’s interesting to see the U.S. actually peaked first around the summer of 2022 and then saw inflation start to decline. By the way, these are consumer price inflation numbers year –over-year. Meanwhile, you saw Japan, Europe, nd the U.K. peak later than the U.S. The U.S. was improving well ahead of these other economies, but yet sometime around the middle of last year, we saw our improvement suddenly stall out and go sideways. Our annual CPI (Consumer Price Index) inflation number hit the low of 3.0 and then got all the way back to 3.5.
20:54 Ryan Kelley: We’ve had this sticky inflation somewhere between 3 and 3.5 for a number of months now. Meanwhile, the other economies are actually seeing continued improvement to the point where, even though the U.S. had inflation improving before the other economies, right now at the latest data, we actually have the highest consumer price inflation of these four economies listed here.
Slide 13: U.S. Stock Valuations Stretched Once Again
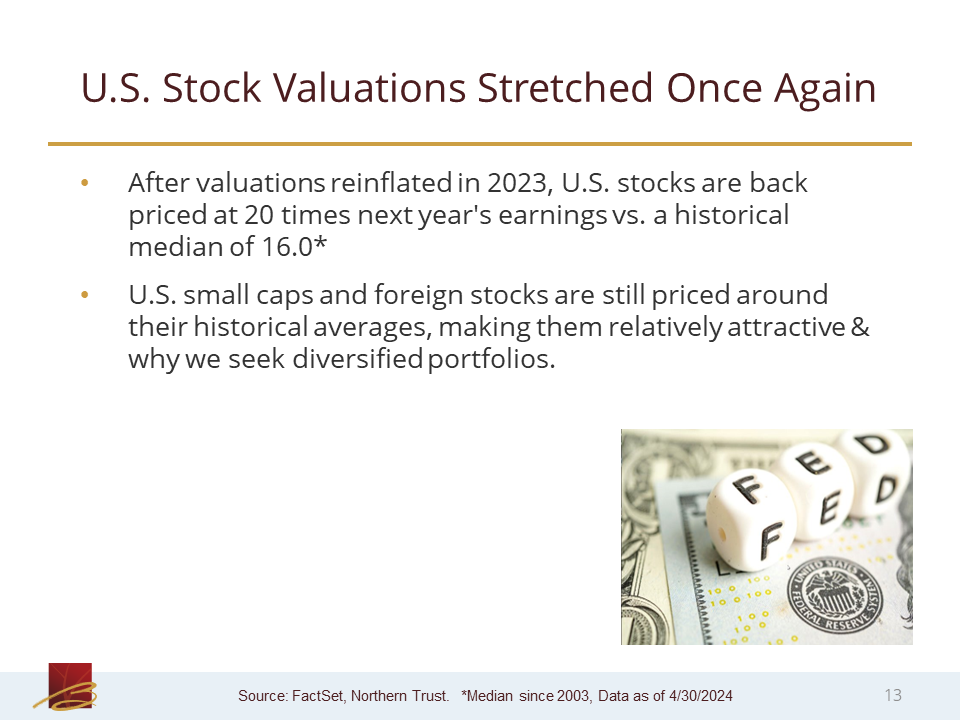
21:24 Ryan Kelley: We’ll look on the next slide. It’s about valuation on stocks. There are a lot of ways to measure valuation. For a rough idea, think about how many dollars you have to pay per dollar of earnings, or dollar book value, or something like that. From an earnings perspective, for every dollar of earnings, you’re now paying 20x to buy the average U.S. stock for the total market. That compares unfavorably to the historic median, which is 16x, and that’s measuring back to 2003. We can see stocks on that measure are overvalued to some degree and certainly at the margin would make them less attractive. That is mostly influenced by large U.S. companies which have a higher weight in the benchmark. If we look at U.S. small cap stocks, or we go abroad and look at foreign stocks (whether we’re talking emerging or developed), we don’t see this premium being charged if you want to buy those securities. So, in that case, a lot of them are actually slightly under, and worst case slightly over, their long-term average. On a relative basis, they look much more attractive than U.S. large-cap stocks. I think that’s just one reason why we don’t just chase after whatever has been the strong performer, because we never know if things are flipped around (like in 2022) and the growth stocks that have been the champions suddenly got hurt badly. We want to make sure we always stay diversified. Staying diversified means we’re always going to be invested in things that don’t do as well as the winners. There’s no way around it.
Slide 14: Investing in Stocks vs. Bonds Today
23:24 Ryan Kelley: With that, let me go to the next slide and I will turn things over to my colleague Laurent to finish up the webinar.
23:29 Laurent Harrison: Thanks, Ryan. That was a great review of stocks and bonds. So you might be tempted to move out of bonds and into stocks based on what Ryan has just presented to you, especially how well stocks have performed over the last seven months. However, I wanted to point out that, as Ryan mentioned, bonds have an incredibly attractive coupon payment at the moment, plus a slight price increase could occur as a result of interest rate cuts by the Fed. And again, while stocks have done well in recent months, specifically over the last seven or eight months, just remember, stock volatility does create on average two minus 5% and downturns and usually one minus 10% downturn each year. You really must be patient with stock investing versus bonds are a little bit easier to hold in terms of that volatility. And lastly, bonds have traditionally been a really effective strategy in offsetting stock losses during a stock downturn while keeping up with inflation.
24:37 Laurent Harrison: On to another topic that I think is very important: Series I bonds. Where are they now? If you’ll remember, investors really fell in love with I bonds in late 2020 to early 2023.
Slide 15: Series I Bonds – Where Are They Now?
24:53 Laurent Harrison: As inflation went up quite a bit, I bonds basically rose with those inflation rates to a high of about 9.62%. However, today, they’ve come back down quite a bit to 4.28%. So just a quick review interest rate changes occur every six months on those I bonds based on inflation. You have to hold them a minimum of one year before you can sell them. And on May 1 of this year, rates [on I bonds] basically fell about 1% to 4.28%. And that is a full 1% below where it was the prior six months from last year, October or so through May, and more than 5% below the rate that actually attracted everybody to I bonds in late 2022 to early 2023. Also, money market rates are higher than I bond rates at the moment, with money market rates hovering around 5%. As I mentioned on the slide, the I bond rates are down to 4.28%.
26:01 Laurent Harrison: So does that mean you should go out and sell your I bonds immediately? No, you can certainly keep those I bond investments because they have about a 5.62% rate prior to May 1. You can keep them another six months at that rate. But you might want to consider selling them towards the end of the year and into next year, depending on what other investments are doing. We always encourage you to check in with your investment advisor before making changes to your investments, even though any I bonds you hold would be outside of Bell. These are not managed or maintained by Bell or at Schwab. These are at the U.S. Treasury site.
Slide 16: Webinar Summary
26:36 Laurent Harrison: Alright. We’ll go ahead and summarize the webinar for today. Ryan had some great slides on where stocks and bonds were from 2023 through today in 2024. We talked about where inflation has been from a high of 9% down to where it is today, about 3.5%. The global economy certainly snapped back into positive territory when Chairman Powell announced a possible cut to interest rates late last year. And we talked about stock valuations as well and I just covered a few key points on Series I Savings Bonds. So, that about wraps it up.
Slide 17: Questions?
27:17 Laurent Harrison: If you do have questions, we’d love for you to submit those questions in your question bar. Just as a reminder, we are not covering those questions today live, but we will follow up with you individually to any question that comes through. Also, please stay in touch. You can do that via our website. Sign up for our E-newsletter. You can email your advisor or, in general, to us and you can always give us a call here in the office at that number. As a reminder, today’s presentation slides are available upon request. We wish you a good rest of your day today, Friday, and a great weekend. Thank you very much for your presence and have a great rest of your day. Thank you.
Slide 18: Stay In Touch!