Original air date: Monday, March 13th, 2023 at 12pm PDT
Presenter: Portfolio Manager Ryan Kelley, CFA®
Slide 1: Annual Review and Outlook
0:00 Good afternoon. Thanks for joining me. My name is Ryan Kelley. I’m a portfolio manager here at Bell Investment Advisors. And the title of today’s webinar is “Annual Review and Outlook.”
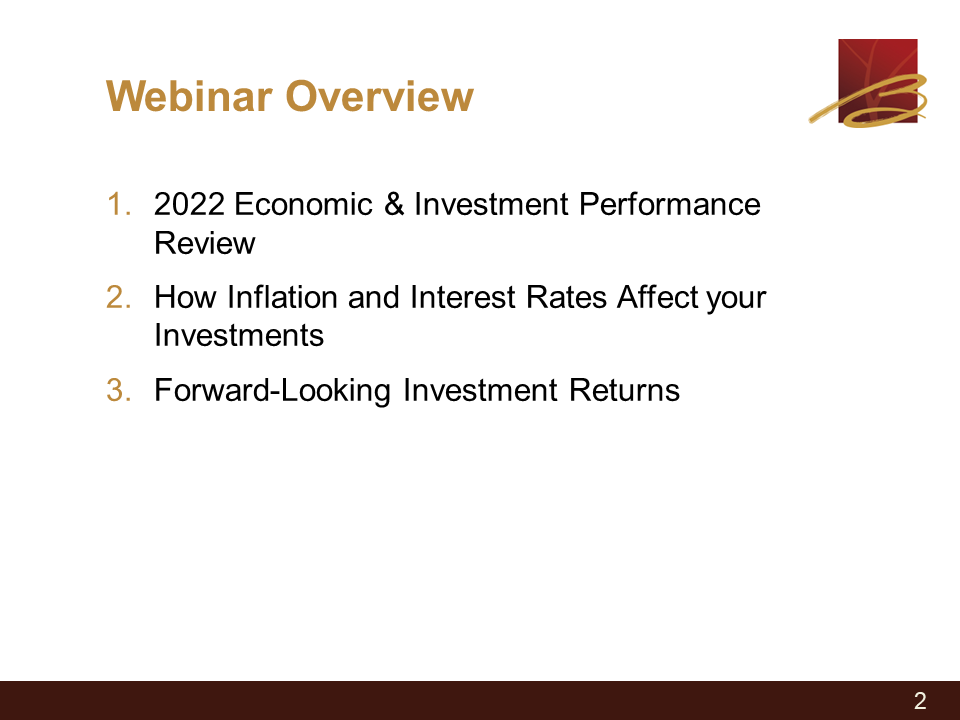
Slide 2: Webinar Overview
0:10 Today in this webinar, I’m going to be discussing three topics. The first is 2022 investment performance. We’re going to be reviewing both bonds and stocks across a variety of styles. Then, I’m going to be discussing inflation and interest rates and how those affect the value of your investments. And finally, I’m going to be discussing a bit about forward-looking rates of return.
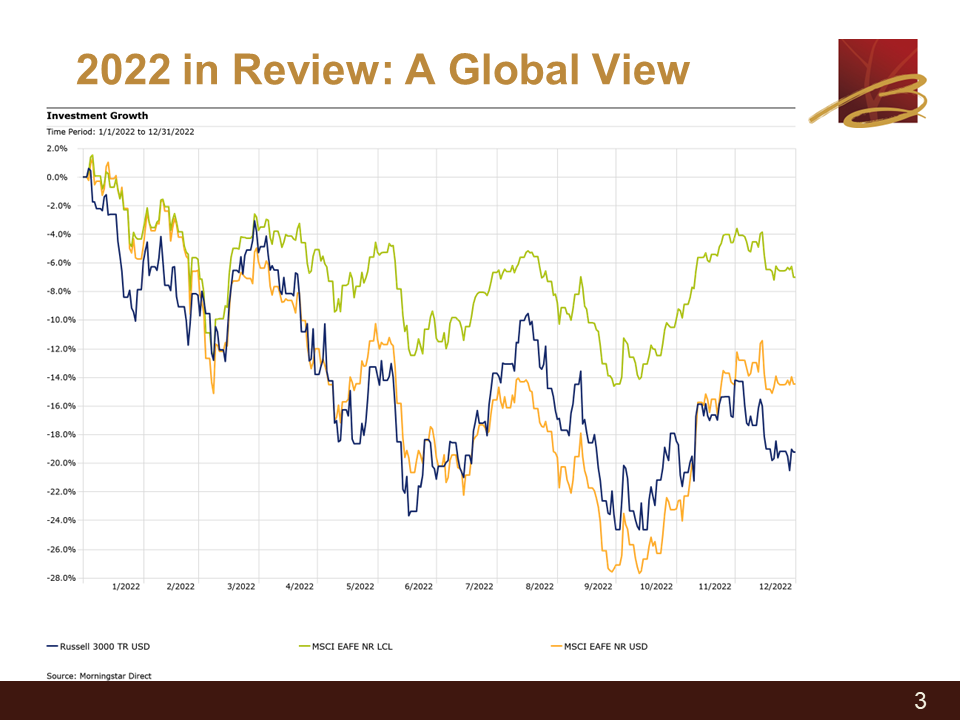
Slide 3: 2022 in Review: A Global View
0:36 It’s probably no surprise to clients that last year was not a positive one for financial markets. Here, we can see the dark blue line is the Russell 3000, which think of that as the general total U.S. stock market. And you’ll see the orange line is an index of international developed stocks, so primarily Japan and Europe. And you’ll see that performance is actually pretty similar. They tended to fall and rise at similar times.
01:13 The performance was very similar up until the very end of the year, where international stocks actually beat U.S. stocks, despite being similar trailing, depending on which part of the year you were looking at. But what’s interesting about that, though, is that if you look at this green line, you’ll see it was much better. What the green line is representing is the same index of those international stocks, but instead of measuring the performance in U.S. dollars, it’s measuring them in their own currencies. So, the Japanese stocks measured in Yen, French stocks measured in Euros, etc.
01:52 What we can see is that, on that basis if you were a local investor in those markets collectively, you actually had a much better time last year. In fact, at many points you were only down 4% or so. And you ended the year down, not even 8%. What that means is that the loss in international stocks (the least developed international stocks) was greatly influenced by a very strong rally in the U.S. dollar. So, much of the loss that we saw and why it was so similar, although it still did outperform ultimately, in the U.S. market was really just currency fluctuations.
02:39 And that’s what actually led to that divergence at the very end of the year. The very strong rally (the U.S. dollar had somewhat of a reversal at the end, in the final month or so, of last year) and you saw the performance diverge away from the U.S. stock market. So, even as a U.S. investor looking abroad and looking at our domestic market, perhaps there wasn’t that much of a difference, although we ultimately did have a decent difference of about 5% or so, which is meaningful. If you had actually invested in local currency terms, just measuring the share prices in their own currencies in their own countries, the experience last year wasn’t really all that painful.
03:24 I think that’s something that perhaps wasn’t covered very well in the financial media. So much of this was really just a currency movement. The U.S. Dollar really rallied versus nearly all currencies, major currencies, at least in the world. And that led to this distorted perception of the stock markets. Actually, international stocks were not that bad last year. It’s really just a currency story.
03:53 But just like the U.S. markets, they did decline. So, I don’t want to wipe that away. And since we are pretty much U.S. investors here, looking abroad, we still felt that effect. But what it does mean is that if there were to be a continued reversal in the rally, the U.S. Dollar (as we saw at the end of last year and even into this year) that you theoretically could have a much sharper snapback in your investment experience. The “orange line” would start converging towards the green line.
04:37 That’s important to keep in mind, especially because currencies themselves are so unpredictable. It is possible to do hedging. There’s a cost to hedge. Essentially, hedging just means eliminating some type of risk. We could theoretically eliminate some of those foreign exchange fluctuations. But, the problem is 1) it’s really unpredictable and 2) there’s a cost.
05:02 So, my philosophy has always been that, in the long run, these things will cancel out or mostly cancel out. You’ll be better off just not attempting to cancel out the risk because you’re worse off trying to cancel the risk and paying a price versus just letting things ride and fluctuate around as they will. Over time, it’ll hopefully wash out.
Slide 4: 2022: U.S. market by Style
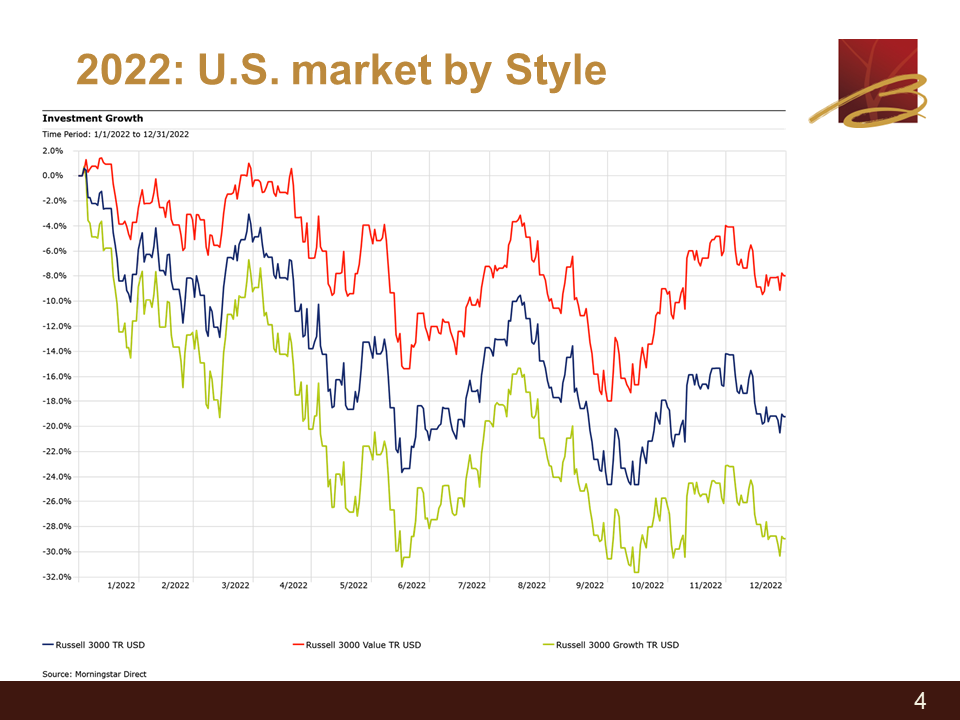
05:30 The other interesting thing last year is that there was a huge discrepancy by the style of stocks you were invested in. Here, I’m showing the Russell 3000 index, which is a total U.S. stock market benchmark. That’s the dark blue line, which is your regular Russell 3000 Total Return index. Then the red and the green line, what they do is they take this index and divide it into two pieces.
06:00 One piece is looking at so-called “value stocks.” These are typically stocks that trade at a lower multiple relative to earnings, book value dividend, things like that, but typically have less growth. And then the green line is representing things that trade at a much higher multiple but typically have more growth.
06:23 If you have a business that doesn’t really grow, it probably attracts a low price. Meanwhile, if you have a business that grows quite a lot, people are probably willing to pay a higher price for it. And those concepts make perfect sense. What does happen sometimes, though, is that investors get a little enthusiastic for certain types of stocks. And this can be represented at the sector level too. Technology is probably one of the better examples.
06:50 If investors get a little too optimistic on growth prospects (technology stocks, etc) and then suddenly, there’s a shift in that sentiment, you can actually see this really strong divergence in performance. So in previous years, the growth stocks have been dramatically outperforming the value stocks. Technology did really well. And that led to much better price gains than value stocks.
07:19 Last year was a complete reversal to that, where a lot of the enthusiasm deflated out of some of these high-flying growth stock names. Some well-known, newer names down 80% or 90% last year and that depressed the index quite a bit. Meanwhile, a lot of the value stocks (which include things like energy, utilities, and consumer staples) actually held up pretty well.
07:47 You can see this huge divergence of performance, where the value stock style section of the Russell 3000, or the U.S. market, was down about 8%. Meanwhile, the growth style was down about 29%, which is a huge differential. It happened in one year.
08:08 There was somewhat of an unwinding of the exact opposite phenomenon we had seen in previous years, not just one year, but over many years. Where really everyone ignored oil companies and some of these more low-growth names and just chasing after very strong growers and assigning very high multiples to those names. And then that drove the prices extremely high. But last year, we saw that that didn’t work out so well for those high-growth names. We saw a lot of enthusiasm evaporate and that really depressed their share prices.
Slide 5: 2022 in Review: Bonds
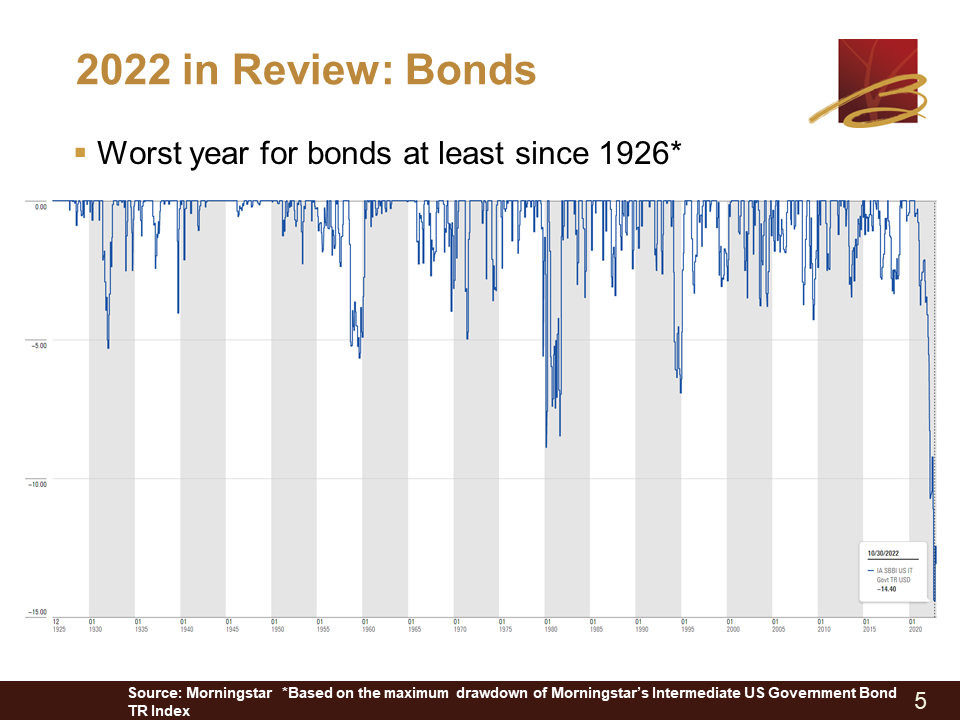
08:47 Onto bonds. This is somewhat incredible, but last year was one of the worst years on record for the bond market. It’s hard to discuss the bond market because it’s a universe of many types of bonds that technically can include a one-year bond or a 30-year bond, corporate bonds, government bonds, etc.
09:15 Here, what I’m simply showing is actually an index that goes back quite a ways back to 1926, which is one of the reasons I picked it over other measures. And, I used an intermediate government bond index that Morningstar has compiled. You can see that this is measuring the drawdown. So essentially, it’s starting from any point in time, if you had invested, what was the worst possible experience that you had. You can see just how much of an anomaly this last year was as far as drawdown.
09:49 Again, it’s called a drawdown because it doesn’t measure anything that goes up. It’s the worst point-to-point possible. It’s not measuring over a year’s time or anything like that. But you can see just how bad it was. And things did recover in the bond market somewhat, but it was a very painful year in 2022. A historically painful year.
10:15 And so that might get you discouraged. I’ll discuss at the end of the webinar. While yes, it was very painful and it’s certainly not something you want to experience. What we’ll see is, once you do experience it, it’s somewhat like a storm that passes through. It’s very bad, but once the storm passes through, it actually can create better conditions going forward. And we’ll see exactly that later in the webinar.
10:42 So, despite having one of the worst years or the worst year on record for the bond market, depending on how you want to define it, it’s actually set us up for one of the best in my opinion. It’s one of the best times to be a bond investor since at least over the last 10 years and actually longer than that. Despite the bad year last year, I’m actually pretty positive on the bond market. I’m more optimistic than I’ve been in quite some time. But we’ll have to wait for that piece of information.
Slide 6: 2022 in Review: Bonds
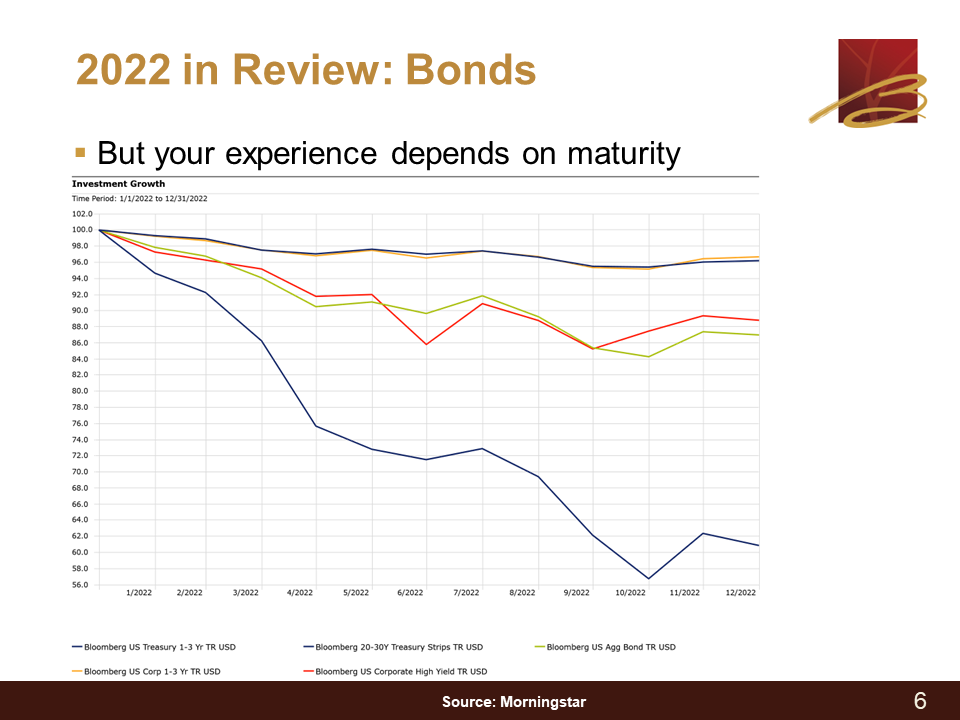
11:18 I mentioned how the bond market we think is this monolithic thing, but actually it’s quite different depending on how you’re invested. So, despite the overall bond market, when people mentioned that, what they’re usually referring to is what this green line is. The names change because the provider (the licensor) has changed. It used to be Lehman Brothers and then it was Barclays and now it’s Bloomberg, but it’s the U.S. aggregate bond index.
11:47 And again, that’s the green line. You can see it was down last year, about 12% or so. At one point, it was down about 14%,15%. They’ve had a small recovery, but that’s still a very painful year. But what you’ll notice is some of these other lines. Each one of these lines is a different segment of the bond market universe. And so of course, the one that did the worst is the one that has the longest maturity because the longer your maturity is, the more sensitive your investment portfolio is to interest rate changes.
12:20 And so, if you go extremely long (20 to 30 years, which is what the dark blue line is showing) you can see just how much worse things can get for you. That is a huge loss on a bond portfolio. Meanwhile, if you look at the two lines at the top, those are measuring about an average of either a Treasury or corporate index, averaging two years (so, a one to three-year index). You can see obviously that there was still a loss last year.
12:53 Interest rates rose pretty much across the board, but the magnitude of the loss was much less. What we’ve been doing for quite some time (more than a year at Bell and potentially even two years) is that we had positioned the vast majority of the money invested on behalf of our clients into shorter-term bonds, specifically because of this interest rate risk.
13:21 So after the pandemic, even pre-pandemic, interest rates were still pretty low, historically low actually. But when the pandemic happened, they went to absolutely rock bottom levels. The 10-year bond, which is often one of the key interest rates that’s measured in financial markets, actually got to about half a percent. Someone at that point in time was saying, “I’m willing to loan the government my money for 10 years and in return I’m okay to receive half a percent interest.”
13:59 And what we said at the time is, “that doesn’t make any sense.” The potential reward is so tiny relative to the risk that we’d prefer to just not be involved in that whatsoever. In fact, I’d rather receive 0% and wait for a better opportunity to come along than lock in that type of meager reward for a lot of risk. We for the most part declined to participate in these longer-term parts of the bond market. And I think last year proved that to be a very wise decision, as you can see the differential between some of these shorter-term types of bonds that we were invested in. Maybe they’re down 4%, something like that last year.
14:44 Granted no one wants to lose money, but relative to the bond market, it was a third or less of the loss. So, I think that proved to be very wise. And luckily, most of our client’s money in fixed-income markets was allocated that way. The losses that our clients experienced in the bond market, on average, were significantly better than the overall average of the bond market.
Slide 7: Inflation’s Impact: Bonds & Stocks
15:12 Moving on to the subject of inflation and its impact on your portfolio. We think about how we value a bond or stock. There’s something that we use called a discounted cash flow method. What that means is that we take all the expected cash flows of our investment, we apply a discount rate mechanism to reduce those values, and then we sum them up to get the present value of the investment.
15:40 And you’ll notice that I haven’t mentioned inflation yet. Well, inflation doesn’t directly feed into this process. What inflation does is, if you have high inflation, it typically means then you get higher interest rates. Higher interest rates obviously increase the discount rate that you apply to these cash flows. So, higher inflation leads to higher interest rates, which leads to a higher discount rate, which then reduces the value of your investment and vice versa.
16:12 Lower inflation typically means lower interest rates, which means less discounting is happening, and a higher end value for your investment. This is true whether it’s a bond or a stock, but bonds are actually far more simple to value. The reason is with a bond, it’s a contract. It’s a promise to repay us because we’ve made a loan to someone and the loan contract specifies on specific dates payments are going to be received. At the end of life of the loan, typically the amount is repaid.
16:49 So, since we know the timing and amount of all these cash flows, it’s actually far more simple to value a bond and determine how it will fluctuate with interest rate changes. With stocks, that’s not true at all, even though mathematically the effect of this discounting method may work similarly.
17:12 With stocks, we don’t really know what the future cash flows will be. There’s also no maturity on stocks. They typically just last until the business gets acquired or it goes under. There’s theoretically no limit to how long a company can last and therefore a stock can last. This process, while theoretically it’s the same, in actuality, it’s much less clear what the impact will be from higher rates.
17:40 There’s also another factor with stocks since there’s so much less clarity on these cash flows. The actual cash flows themselves, or at least what we expect they might be, changing around to can have a huge effect on stocks’ price swing and that can overwhelm any change in interest rates. You would think higher rates would hit stocks and I’ve just explained the process about how they do. But at the same time, you can imagine that if rates are going higher because the economy is really good and our profits on our stocks are going up, that effect of higher profits can actually overwhelm the suppressive effect of higher rates.
Slide 8: Inflation’s Impact: Stocks
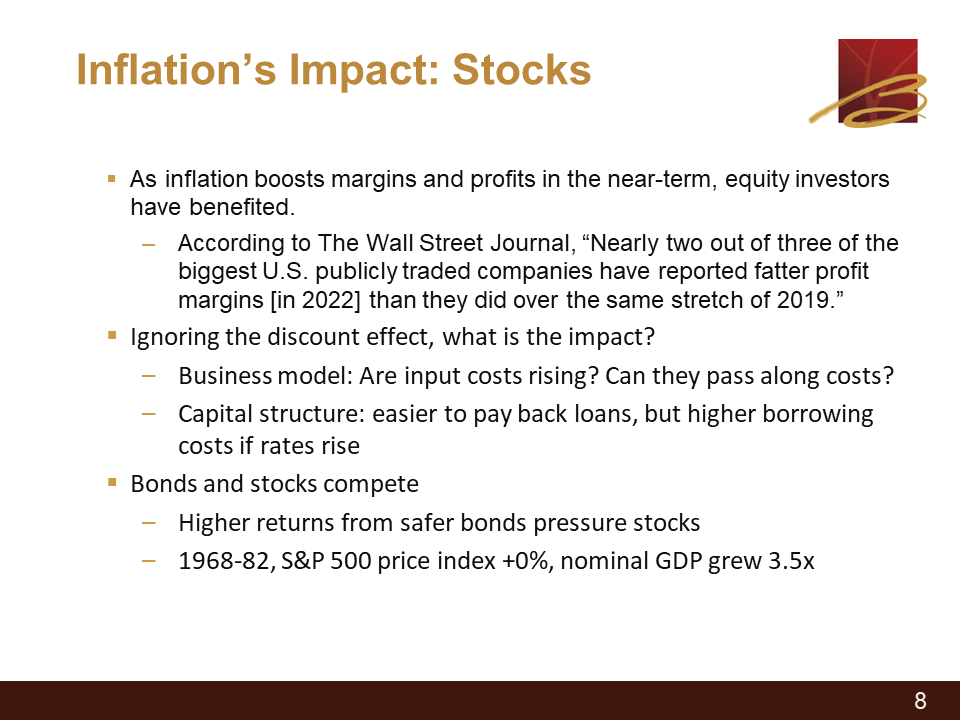
18:29 With stocks themselves, inflation can actually impact those cash flows. That’s another unique feature that stocks have compared to bonds. I have a quote here from The Wall Street Journal. They analyzed large U.S. publicly traded companies and they actually found that higher inflation seemed to be feeding into actually higher profit margins. So, not only was inflation let’s say 10% and maybe sales went up 10%, profits actually expanded beyond 10%. They found that higher inflation was actually allowing companies to not only have (in nominal terms) higher sales, but they’re actually keeping a larger percent of those sales. So, costs didn’t grow in line with those higher sales from inflation.
19:20 The business model of the company itself is going to matter when it comes to inflation. If you’re a company that has rising costs, say you’re an airline company, and oil prices are going up. The cost to fly a jet is going up. That’s obviously negative, but can you pass that cost along is a key question. Ultimately, will your airline passengers pay a higher ticket price corresponding to these higher costs?
20:00 Some businesses can pass along costs very easily and other ones cannot. Meanwhile, if you’re an oil company actually extracting the oil, your costs may go up to some degree, but not nearly the rate that the price of your raw commodity has increased. So in this case, inflation may be very beneficial to you. And of course, that higher extractive price that you’re getting for your oil can just be passed along very easily to your clients.
20:32 The business model is a key impact on how inflation impacts your stocks. That can be tricky across an entire diversified portfolio to really determine how change in inflation is going to impact a large basket of various companies in different sectors. There’s another effect with a company: its capital structure. Even in the same business, you have some companies that choose to use mostly equity financing. They don’t take on a lot of debt.
21:09 For those companies, the impact of inflation is really more on their revenue and costs. But if you were a company that decided to use a lot of debt financing, and suddenly there’s a lot of inflation, on the one hand, it makes it easier to pay back those loans if your sales rise with inflation. But on the other hand, if interest rates rise along with inflation, which they typically do, now all this debt that you’ve taken out previously, either you’re going to have to pay that off, which is painful because you’re going to be diverting more of your profits into just debt repayment. Or, you’re going to have to roll over the debt and you’re going to be rolling it over at suddenly a much higher rate than you did when you originally took out the debt.
21:59 One part is negative and one part is positive. So, you can see the complexity of trying to say what inflation’s impact is on stock if you’ve ignored the interest rate effect. And then one final point is to say both stocks and bonds compete with each other. Obviously, if you’re an investor and you look at either one of these asset classes, and if one substantially looks better than the other, you’ll probably allocate more money to it. That shouldn’t be a controversial statement.
22:31 So, what happens is if interest rates are higher from bonds, which are safer than stocks because they’re less speculative and have lower volatility. Imagine I could suddenly get 10% on a five-year bond from the U.S. government. Well, if that’s higher than my expected rate of return for stocks, then I should sell my stocks and only buy bonds. As that happens, it actually puts pressure on the price of stocks and drives their value down because what they’re trying to do is maintain competitiveness with bonds. So, as interest rates rise, and bonds become more attractive, it’s actually pressured stocks because their value has to fall for them to maintain competitiveness with bonds.
23:26 There’s a great historical example I can give you is from the late 60’s to the early 80’s, which was a period where more so towards the end, there was high inflation. It actually started out with some high inflation and then accelerated towards the end of the 70’s. And corresponding to this high inflation, you had high interest rates. Well, this exact effect I’m talking about where stocks need to compete with bonds occurred.
23:57 So, over this time period, the U.S. economy actually grew three and a half times. That’s not counting for inflation. Just the nominal growth was actually three and a half times larger than in the late 60’s. But yet the price return (ignoring dividends) of the S&P 500 was actually zero. And you think how can that be? If you had such a large expansion in the economy but stock prices didn’t change at all?
24:27 What was happening is the corporations were of course making higher and higher profits over this time. But because the interest rate on bonds was so high (in the mid teens) for long-term bonds, that was just so attractive relative to the historical return on stocks that the price had to fall to maintain that competitiveness. So, you just have this persistent pressure coming from bonds just pressuring the stock market over this time period. As a stock investor, it didn’t work out well for you. But at the same time, this set us up for much better times ahead when ultimately interest rates did fall once inflation was tamed.
Slide 9: Good News: Higher Forward Rates of Return
25:16 And that’s my next point exactly. Oftentimes, when we have a bad experience as an investor, what’s happening is actually setting us up to have a much better experience going forward and vice versa. When we have a really great experience as an investor, oftentimes that’s setting us up to have a not-so-great experience going forward. And so if you look at the stock market last year, we started the year with a fairly expensive stock market.
25:49 When I say expensive, I’m saying for every dollar of profit, how much are investors willing to pay for that profit? It was historically expensive at the start of the year. But with the losses that occurred (I mentioned the enthusiasm kind of deflating), we actually returned to a much closer historical level. In my opinion, we actually got to a pretty good level last October. We’ve since had a rally, so things don’t look quite as attractive as they did back then. But regardless, the stocks are much cheaper than they were at the start of 2022.
26:27 Earnings forecasts have declined a little bit, but not that much yet. They could still decline going forward. But that means if we didn’t have much change in earnings, that pretty much all of the losses in the stock market last year was just purely investor interest changing and higher interest rates suppressing stock prices from a previously elevated level back to somewhat of a more normal level. It wasn’t caused by any underlying weakness in companies, at least on average. Certainly, there’s a lot of companies that were new and growing. They had never made a profit and suddenly their cost of capital went higher and their growth prospects didn’t look quite so rosy. I had mentioned that some of them declined 90% or 80%. But for a diversified investor, mostly what we saw in the losses last year were really just optimism deflating out and things sort of normalizing. It wasn’t driven by any fundamental corporate weakness or anything like that.
27:33 And of course, the bonds also struggled. It wasn’t the higher inflation but the Fed’s response to higher inflation. As bonds have done worse in this case, what’s happened is their forward rate of return has gone higher. The stock market is valued still historically high, but not nearly as high as it was. There’s maybe a similar valuation to what you might have seen in 2017, 2018, or 2019.
28:12 With the bond market, I mentioned we had this historically bad year. Well, what’s that’s set us up for is actually, I haven’t seen the bond market look this good probably since about 2007 or so. Short-term rates are quite high. That hasn’t been true since the financial crisis. They’ve never been this high. Even going to say five years out, you can still get quite a high rate. In my opinion, the way the bond market is priced right now actually looks very attractive and looks better than it has looked in over a decade. Stocks maybe not so much but certainly they look a lot better than they did a year ago, at the peak post-COVID.
28:59 Both bonds and stocks look much better from a forward rate of return perspective. And bonds actually look really great, even going longer term, though not for the entire history of the bond market. But they look pretty good right now compared to where they did even in 2013. You can pick almost any time in the last ten years and they look better today than they did back then. So it actually looks to be a pretty good time to be a fixed-income investor, in my opinion.
29:29 And as an aside, there’s something called TIPS. We do invest in them quite a bit at Bell, at least we do now, and that could always change in the future. But they actually look pretty good. Part of the reason is you actually finally have a chance of getting a real rate of return. What that means is that, [after inflation, if you buy a five-year TIPS today] you basically make a loan to the U.S. government for five years. They will guarantee you not only your principal back and not only adjusted for inflation, but even on top of that they’ll actually give you a positive return even above inflation.
30:14 That’s something that hasn’t been true for quite a while. During the high inflation periods and COVID, etc, you actually would get a negative real return. So in nominal terms, yes, you would get your money back and you would have more dollars than when you started but the purchasing power would actually be lower. That’s actually not true now. So to me again, TIPS are just one example that the bond market actually looks quite attractive right now. Certainly, much more attractive than it’s looked anytime in the past ten years.
Slide 10: Forward Rates of Return, continued
30:49 One thing we track at Bell is that we go out and get a lot of large financial institutions’ forecasts of 10-year rates of return. I do an annual process where I go out and collect those from various providers and aggregate them and to see what we can expect and also how those have changed over time. If I look at the ones I’ve collected (probably at least eight or ten of them) and I compare them to last year for both bonds and stocks, their predicted per year rate of return going ten years in the future has actually increased by 2%. This is a massive increase, to collect that and compound that over ten years.
31:34 To me, that’s just further validation that the losses that we had in 2022 have actually set us up to have a much brighter future going forward. Now granted, there’s no guarantees of any of this. There’s simply the starting point and a forecast but those have improved quite a bit. And a 2% return is huge because again, this is compounding year after year after year over ten years. So, the forward expectations have improved quite a bit. The reason is for the losses we had last year. I know a lot of times when we see losses, we don’t like them, but we have to realize that they set us up for having a better time going forward as investors.
32:20 I’ll also point out that I mentioned the U.S. stock market is still somewhat expensive, although not nearly as expensive as it was at the start of 2022. There are areas of the stock market globally and even domestically, that actually are trading at a discount to the long-run average. The U.S. market is still at a premium to its long-run average. But if you look at either U.S. or foreign small-cap stocks, those are trading at a discount to the long-run average. Large cap international stocks are trading at a discount to the long-run average.
32:55 Actually, if you look at those value stocks we’re referring to (not growth stocks everyone was chasing previously), those can vary between a little bit expensive to actually cheap relative to their long-run averages. There’s different measurements, so there’s dividend yield and book value and forward earnings, trailing earnings etc. and mentally amalgamating these measures relative to their own history. You actually can today buy stock investments that trade at a discount for the long-run averages. To me, this is another piece of evidence that your rate of return going forward (on stock investments) may actually be quite attractive and certainly on bond investments, which is the much more straightforward argument. You look at your starting yield. If you buy and hold, your end result will be pretty similar to that starting yield. So, it’s much easier to make a prediction because we know from prior examples. We can see the evidence and see how that ultimate number matches pretty closely with the starting yield.
34:07 We can be a lot more confident on the bond side of things with the forward rate of return you’ll achieve. It’s less so with stocks. The exception is basically growth stocks, both domestic and international, but more so domestic, are still traded at pretty elevated levels. That’s probably the one part of the investing universe that perhaps won’t be so great going forward. “Won’t be so great” doesn’t mean negative, it just means perhaps underwhelming relative to other options you have to invest in the equity markets.
34:47 The other thing I’ll point out is, if interest rates stayed stable (as we mentioned, that is a factor with stocks), your return is basically the profit growth and the dividend yield paid out, as well as any changes in valuation. So, if we can buy a stock that trades at a 20% discount to us longer on average, and then over the next 10 years, it simply reverts towards average. It doesn’t get expensive or go above it. That’s a 20% extra rate of return in addition to whatever the profit growth is and the dividend yields paid out, etc. You potentially can have this tailwind if this discount actually then shrinks back to normal. You’ll receive that in the form of a higher stock price if that were to occur. Again, there’s no guarantee this occurs, but it has at least set you up for the potential for it to occur, which to me is an attractive scenario.
Slide 11: Conclusions
35:54 In conclusion, last year was a bad one for both bonds and stocks. Within the bond market, it was really the longer maturity ones that suffered the steepest price declines. Meanwhile, the shorter maturity ones held up significantly better. Within the stock market, it was really the growth names, especially technology stocks, that suffered the largest declines in comparison to a lot of the “old economy” value type stocks, such as the oil sector and the financial sector, did significantly better.
36:29 As far as the impact on your portfolio, of higher interest rates and higher inflation, remember the processes: higher inflation leading to higher rates, which put pressure on both bond and stock prices. You’ll see an asterisk on stock prices because occasionally if the economic background is strong enough, the effect of profit growth can overwhelm the suppressive effect of higher rates and you can still see gains on your stock portfolio.
36:58 And then finally, we’ve discussed long-term investors and what type of impact has been on forward rates of return, how those rates of return have increased. The expectations have increased and things should be set up significantly better than they were at the start of last year for your expected experience going forward.
Slide 12: Have Questions?
37:20 If you have any questions or want more detail on any of the topics covered today, feel free to reach out to your advisor. We’d be happy to get back to you with additional information.

Slide 13: Stay in Touch!
37:31 And with that, please stay in touch with us. You can visit our website, subscribe to our newsletter, as well as contact us. Again, we’re happy to provide this presentation if you’re interested in it. So, thank you so much for tuning into the webinar. I apologize if that one went too long. There was a lot of good information. I want to make sure it was covered thoroughly. I hope you have a good rest of your day. Thank you so much.