
There seems to be an overwhelming concern among investors that the markets, and ultimately their own investments, will not perform well this year due to the looming presidential election. Although we cannot predict the outcome of the election or how the markets will respond, the following chart may alleviate some of that concern:
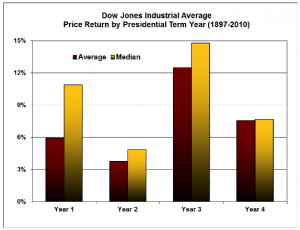
Based on the price return of the Dow Jones Industrial Average from 1897 to 2010, the fourth year of a presidential term is the second best performing year on average, returning over 7.5%. During this 114-year period, Year 4 of a presidential term has produced a positive return 75% of the time.
We do not recommend using this graph to predict market returns for any given year, but rather, offer it as factual information to counteract the prevailing investor “jitters”. Our research indicates there is no correlation between an election year and poor market performance. The last century of market history indicates there is little reason for concern. With the Dow Jones up over 9% this year, we are hoping for another election year with positive returns.
Coming up September 26, 2 – 2:30 pm
Webinar: “How the November Election Results Could Affect Your Portfolio”
– Understanding historical market performance leading into an election
– Examining the effects of each candidates’ policy on your investments
– Preparing your portfolio for the “fiscal cliff”
Presenters: Jim Bell, CFP®, President & Founder, and Matt King, CFA, Managing Director, Chief Investment Officer